GA4 API request quota limits
If you try to connect your Looker Studio (previously Google Data Studio) dashboard to the Google Analytics 4 (GA4) data source directly, you may see the reports break and show error messages.
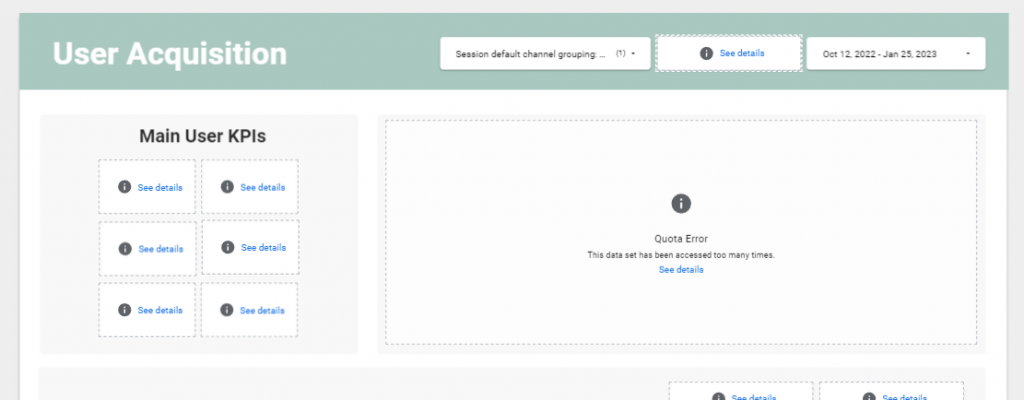
This is related to Google’s API request quota limit introduced in November 2022 for GA4 and Looker Studio visualizations. After numerous complaints from users about GA4 API, Google adjusted the limits and made them slightly less severe. Still, using the native connector may not be the best solution, especially if you have a lot of data, do not want to limit user access, or simply want to interact with filters as much as you need. Fearing that something will break because of these limits and having to wait until quotas are reset is not an ideal scenario.
If you are reading this article, you likely already know about the Google API limits issue and are looking for another way to build insightful reports.
We will mostly talk about Looker Studio because it was one of the first and few popular reporting tools that had a built-in connector to GA4. Power BI, for example, does not have it and requires ways around connecting even before the limitations. Nevertheless, some of the information here may be useful for you even if you are going to use another BI (business intelligence) tool.
Why not just use GA4 user interface reports?
The default reports and explorations in Google Analytics 4 may be good enough for having a general look at data. But they are not perfect.
The default reports are quite limited. Explorations provide you with a bit more flexibility, but when you use them, you cannot retrieve the data past your retention period (14 months max for free account users and 50 months max in the paid version). Exploration reports are subject to sampling and do not show the full picture when the event volume exceeds a certain number.
Data thresholding is applicable to both report types. You cannot create custom metrics and dimensions in the GA4 user interface for more advanced analysis. And, you may not want to share access to GA4 with people who may need to monitor just a few charts.
How to handle the request limits
You can limit the access of users to reports or reduce the number of charts to stay within the quotas for a bit longer—but we do not want to limit the company’s potential to generate actionable insights, right? 🙂
Apart from accessing GA4 data in Looker Studio, an option is to extract data from the data source within your token limit. However, this comes with constraints and would require a lot of manual, repeated manipulations to get updated data.
When it comes to better solutions, some prefer using third-party connectors for GA4 and Looker Studio, as they often have a simplified interface and do not require writing SQL to get the data.
On the other hand, many professionals have a strong preference for BigQuery. Your choice will depend on your case, so let’s dive deeper into how BigQuery figures in this situation to help you decide.
What is BigQuery, and how does it help with GA4 API?
BigQuery (BQ) is a serverless data warehouse from Google belonging to the Google Cloud Platform services. It allows you to store and analyze data.
Some of its core benefits for BI in eCommerce are:
- Flexibility
While with connectors you can get the data easily, there are often limitations on what you can do with it. The possibilities with BigQuery are way broader. You can modify any data the way you want. And not only can you input GA4 data into BigQuery but also data from other marketing platforms (like Google Ads or Youtube), your backend store data, and more. This allows you to aggregate data for achieving more advanced insights on the full user journey or to come up with a custom attribution model which fits your business more. You can also make use of the most popular machine learning models as easily as with writing SQL (BQML SQL). And that’s just a few examples.
- Scalability
No need to worry about how you will manage your data as you grow, Google takes care of it all.
- Affordability
You pay only for the resources you use, unlike with traditional data warehouses.
GA4 allows the export of raw data to BigQuery for free. This option was not available for Universal Analytics before and was only present in the paid version of Analytics 360.
On top of that, data storage is extremely cheap. That is an incentive for establishing the linking now even if you’re not certain you will actively use the GA4 data in BigQuery. But, the main reason for doing so is for you to be able to use the historical data later when you need it—because BigQuery does not allow the retroactive export of GA4 data without third-party solutions, and raw data is not even guaranteed.

Approach to setting up reports based on BQ GA4 data
Since the data exported to BigQuery is raw and has a special structure with nested rows, you will have to do certain manipulations to get the fields you need and to ensure efficient consumption of resources.
The general workflow for building reports based on BQ GA4 data is as follows:
- Define the data you need for your report and write a query (queries) to create a separate table(s) which will then be used as data sources in Looker Studio. Never use your GA4 export events table directly in dashboards → you will most likely not make use of all this data, and it will drive up the costs tremendously.
- Schedule the query (queries) to update automatically with the frequency needed.
- Create a Looker Studio data source based on the tables. You may need to create new custom fields manually in the data source as not everything can be included in query results. For example, if you need a detailed report, you may have to include numerous fields, some of which may distort the other metrics you would like to include. In our case, some of such examples were user and session count, and consequently, the eCommerce conversion rate. Instead of including them in the data source as a metric, we included the unique session_id and the user_pseudo_id, and then made the calculations of distinct values in Looker Studio, and further worked with this data.
- Build the report based on the data source(s) you defined.
Possible costs to overcome Google API limits
The main aspects for which you will be billed are storage and analysis. Storing GA4 data in BigQuery is very cheap, with smaller eCommerce sites not hitting the free threshold for months or years, and bigger clients only paying as little as $10/month.
The first 10 GB of storage per month is free. After that you have to pay $0.02 or $0.01 per GB depending on whether it is active or long-term storage.
The bigger part of your bill will depend on the analysis resource usage.
BigQuery provides two pricing options: on-demand and flat rate.
On-demand analysis pricing
You are billed for the queries you run. To make it clear in our context, this includes:
- The queries you run manually or in a scheduled way in BigQuery
- The queries which are run in the background when users view reports based on BigQuery data. Separate queries are run for every user who views the report. Additional queries are run when users interact with the report filters.
Estimating the on-demand pricing without looking at the individual case is relatively difficult since there are a lot of variables impacting the final price, including: how advanced you want your report to be, what date range you want to include, how big your site traffic is, how often you need the scheduled queries to update the data, how many users view the report and how actively they interact with it.
The first 1 TB of querying per every month is free, after that you pay $5 per TB.
If you need some very approximate estimates for what BigQuery may cost you, here are sample cases:
- Case 1
A site with an average of 175K sessions and over 4M events per month, with the GA4 data stored for 4 months (which amounts to 100MB of logical bytes) and multiple detailed eCommerce reports updated daily, and used frequently by the team costs $10 per month at the time of writing.
- Case 2
A site with an average of 250K sessions and 3.5M events, with the GA4 data stored for 2 months (which amounts to 160.32 MB of logical bytes) and one detailed general performance monitoring report updated daily, and used moderately currently stays within the free tier.
Interestingly, as you can see, even the volume of data stored can be bigger for sites with fewer hits, because every data setup is individual.
Of course, these reports rely on data with appropriate partitioning and clustering which will be mentioned later in the article.
If you need a simple report for the main KPIs, you may remain within the free tier for a pretty long period. For a business with up to 100K sessions per month, costs may be within $100-200 for querying a year’s data with moderate report usage and with the default report date range covering the last month. Very active report usage with a lot of historical traffic data and frequent updates will consume more resources, entailing another pricing tier.
Flat-rate
Flat rate pricing provides you with a stable bill size and is a good choice for processing hundreds of terabytes of data without worrying about the costs.
If you choose to pay a fixed monthly fee, then your analysis costs will be $2000/month. Going for an annual subscription will lower that to $1700/month. Another option is purchasing short-term commitments with the rate of $4/hour.
Please find more detailed information about BigQuery pricing on this page.
You may also find the Google Cloud Pricing Calculator useful if you want to input your personal estimations of storage and querying.
Cost control
If you go with the on-demand pricing, there are ways to control and optimize your costs.
Query optimization
Some of the most important principles of creating new tables for reports is including partitioning and clustering.
When you partition a table by a field, you “divide” it into a lot of separate subsets (partitions) of data.
You can select only one column to partition a table by. We usually partition by event_date with GA4 data. So when you need to see just the last month of data by default in your monitoring report, additional queries run automatically when viewing the pages, and they consume just that month’s data without processing the multiple years of records.
Сlustering sorts the data by columns of choice in a logical order which also makes the resource usage more efficient. You can select up to 4 columns for clusters in a table.
It is recommended to use the fields used often in report filters in your clustering setup.
Aside from that, the frequency of scheduled queries also plays a big role in your final bill, so look at your needs and do not schedule the queries to run more often than you need it.
Cost usage notifications
You can get notifications about usage costs so as not to get surprised by the bill at the end of the period, and be able to adjust if needed. You need the Billing Account Administrator permissions for this.
You have to go to Billing -> Budgets and Alerts -> Create Budget, and here you can set up the monthly budget and the milestones for notifications (e.g., I define the monthly budget of $200 and also get notifications when we have used up 25%, 50%, and 75% of the budget if I want to).
Resource usage reports
Google Cloud Platform provides you with built-in reports about the volume of resources you consume on different services, and this should be generally enough.
But if you would like to dig deeper and see what queries (and their types) consume the most resources, you may want to set up an export of data from information_schema.jobs (you have to have the permission of the BigQuery Resource Viewer) and build a report on that data, which you will further be able to analyze.
Let us know if you have any questions about GA4 API request limits and how to overcome them with BigQuery and Looker Studio!
Do you need help setting up your BI reporting using GA4 data with BigQuery or have custom requests? Let us help you! Get in touch with us by filling out the contact form below, and our Analytics team will jump on a call within the next 24h.

Share on: