In some things in life – intuition is key. It is not always the case, however. As personal perferences, biases and opinions can lead you astray in the world of UX Design resulting in a website designed for you, not your customer.
We have found that there are 4 key cornerstones to designing the website for maximum efficiency when it comes to customer feel and ensuring that you’re not crippling your conversion rate. Let’s look at them in great detail from data gathering to practical measures to take in your UX design journey!
The Four Steps of Designing an Excellent User Experience
A website has to capture the right feeling; it has to create the right mood; it has to immerse you into its environment. Oftentimes, clients are convinced that they know how to create this perfect website because they see themselves as one of the potential customers. They’re rarely right.
This is not to say that gut feelings and this kind of insider information are useless. Not at all. Rather in an age of iterative optimisation, data is king. When your intuitions fail, data won’t.
At Scandiweb, we have developed a methodology — a workflow, consisting of four steps, that has continuously proven itself to be successful. It is centred around gathering real data, analysing it, understanding the customers and continuous iterating and testing aimed at perpetual evolution.
The 4 steps are – User and Conversion Rate Optimisation Research; Strategy Development, Analytics & Building an Ideal State; Performing a Gap Analysis; Building, Measuring, Learning, Iterating.
In what follows, we will look at each of these steps in-depth, outlining a winning UX design methodology.
Step 1: User and CRO Research
The first step is all about finding where and why your eCommerce store, Blog, website is leaking money, readers and/or visitors. This research is crucial, as it will reveal what is working and what isn’t, indicating where improvement is needed most. Since this step essentially includes an extensive audit of the current situation, it’s one of the lengthiest and also most valuable parts of the design journey.
It consists of a Google Analytics health check, data analysis — both qualitative and quantitative, competitor analysis, and user research. Let’s go through each of them in turn.
Google Analytics health check
Did you know that 90% of supposedly data-informed decisions are based on analytics setups, which are broken in one way or another?
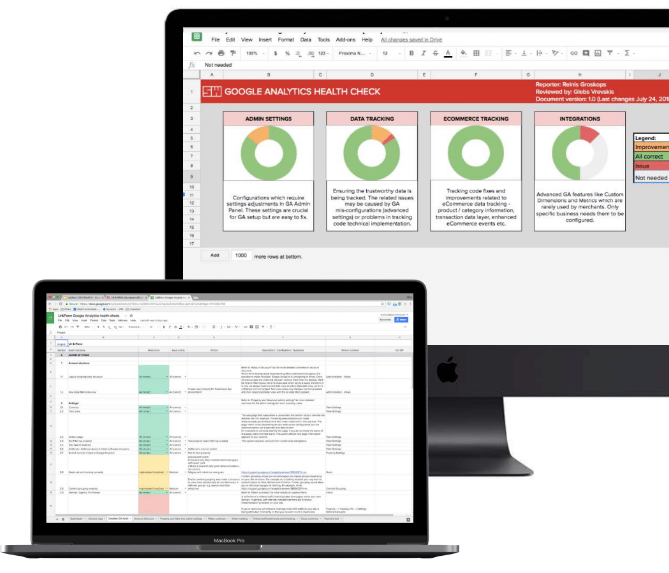
An analytics tracking health check ensures that everything that needs to be measured for efficient user behaviour analysis is being measured and the data isn’t corrupted. Essentially, the health check should result in clean data that shows actual user behaviour on the site and would allow making correct assumptions regarding potential UX improvements.
Data Analysis
To avoid personal preferences, biases and intangible gut feelings corrupting the decision-making process regarding designs, the focus needs to be 100% evidence-centred and be on data-based insights obtained through deep data analysis. Two types of data are analysed:
Quantitative data:
Metrics and dimensions that indicate trends in user behaviour based on an analysed audience sample. This analysis targets the question of “WHERE are the problems and which areas can be improved?” and provides a view of the principal pain points.
- Google Analytics in-depth user journey, sales funnel and user behaviour analysis
In-depth site performance, user behaviour, sales funnel, traffic source and advanced user segment analysis to find problems, opportunities and success areas of the online shopping experience. - CRO Profit Grid
Website performance analysis by key user dimensions and user segments, which enables efficient insight gathering on user behaviour that correlates with specific user segments and helps spot any potential problems on the website.
Qualitative data:
Exploratory research that helps understand underlying reasons, opinions, and motivations. It provides insights into the problems and helps develop hypotheses for quantitative research. This helps tackle and answer the questions of “WHAT are the problems and improvement areas and WHY are they problems?”
- Heat-maps
Visual data representation as varying temperature that describes the intensity of user actions in specific areas of the website in defined periods of time. - Eye-tracking
Numeric analysis and visual data that shows user behaviour and what elements grab their attention on conscious and subconscious levels - EEG Brain Scanner
Unveils data about testers’ brainwaves to analyse consumer feelings towards your product, how they react to messages and content by tracking levels of engagement, frustration, meditation, long-term excitement and focus - User Testing
Conducting user tests to analyse how well users are able to complete important tasks and find information on the website and identify potential UI issues (onsite or online) - Session Recordings
Analysing recordings of actual user sessions on websites to reveal patterns in user behaviour and identify UI issues - Expert Evaluation
Review of a website’s user interface, messaging, information infrastructure by two or more usability specialists.
Competitor analysis
It is rare that you’re the first to do something. Especially in fields where the competition is fierce, your competitors are likely to have invested considerable resources in perfecting their UX. This means a lot of valuable information can be gained by looking at how they do it.
Overall Design — How should users feel while visiting the website — like in a luxury store or in a playground?
Implemented Functionalities — Which functionalities might help improve the user journey?
The Tone of Copy — How does the brand communicate with a customer?
Customer Service Availability and Attitude — How easily can users reach Customer Service?
Copying competitors is not the best avenue to take, however ignoring fundamental & well-established features that work would also be silly.
User Research
We perform a deep analysis of website users and prospects using:
Data from Google Analytics — conducting and analysing demographic data, interest reports, exploring traffic sources and social media engagements.
Analysis of social media presence and customer accounts — who are your customers, what are their values, what are customers saying about your products, who are their influencers?
Customer Service and Live Chat analysis — what are the most common problems users face when shopping the website, what hesitations do they have, what language do they use when talking about the products?
*Conducting and analysing surveys from Customer Care* — what questions prospects are asking, what are their worries, what is their feedback?
Conducting and analysing surveys from online and physical store customers — why have they chosen your brand, what are the values they care about, what other brands they consider, what almost stopped them from making an order?
Step 2: UX Strategy Development, Analytics & Building an Ideal State
After extensive User Research, we take all the lessons learned and insights gleaned and create the ideal combination of design, messaging and content. We describe in detail the changes to be made and the elements to be kept, with reference to the results of the User Research.
Content and Messaging Strategy
Content does wonders for SEO — it adds value to your product, it encourages engagement, it increases organic traffic and, most importantly, it turns guests to customers.
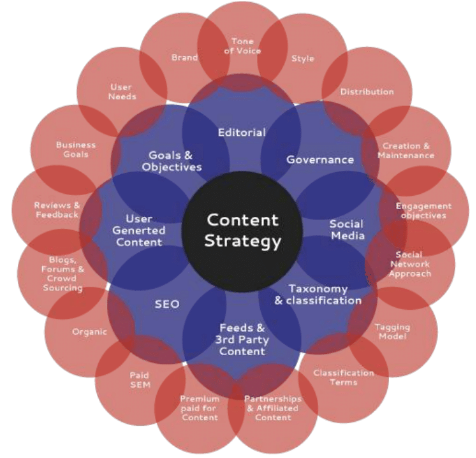
A content strategy is crucial for finding new shoppers and solidifying a lasting bond with the loyal ones! During the content strategy and messaging phase, we:
- Perform an audit on the existing content
- Spot the gaps and opportunities in existing content for the key site pages, determine which types of content needs to be created
- Persuasive content copy creation to support the messaging strategy and reinforce the company values
- Lay down the strategy for existing content repurposing and new content creation
User Journey Mapping and Sitemap Development
Customer journey map is a visual representation of users’ desired and real interactions with your website. It helps to discover and visualise the journey users take to discover your products and how design should help towards reaching their goals and improving the User Experience.
Site Analytics Tagging Matrix and SEO Review
An underlying measurement framework to test and evaluate the success of the new designs needs to be developed during the initial strategy and design prototyping process. A tagging matrix is created for:
- Tracking eCommerce activities and main business KPIs
- Tracking user interactions with site UI elements and their influence on Conversion probability
- Tracking customisations with product scoped and user based custom dimensions and metrics
In addition to the Tagging Matrix development, our in-house SEO specialists are involved in the project’s scoping and planning phase to ensure smooth Organic rankings transition to the new designs without losing valuable traffic volumes that contribute to the business KPIs.
Technical on-site metadata, open graph, structured data, content and navigation SEO requirements are laid down to avoid the common mistake of ignoring site redesign SEO implications.
Conversion Optimised Wireframe Development
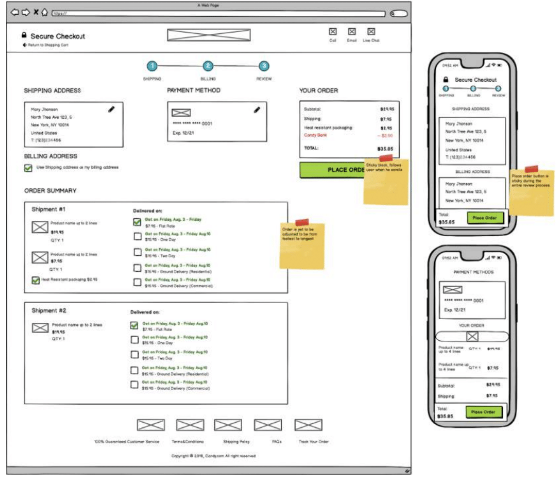
The Prototyping process is started by gathering the user journey, content and messaging strategy and turning it into blueprints that define a web page’s layout, content, and functionality.
They do not convey design — i.e. colours, graphics, or fonts, instead, they’re a visual guide to elements on a page and communicate the idea of experience.
Wire-framing process progression:
- Information structure
- User flows/interaction design
- Visual fidelity
No Lorem Ipsum or placeholders. We use the actual copy. Message first; the design is only there to support it.
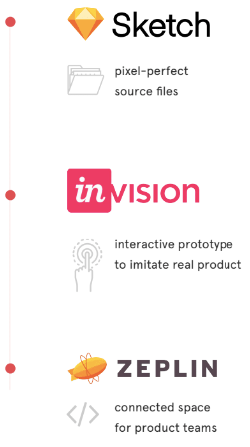
Interactive Prototype Development
When the initial set of wireframes is ready, we proceed with interactive design prototype development. This process includes:
Step 3: Performing a Gap Analysis
In order to de-risk the design projects, avoid UX/UI problems and waste of development time in reworking solutions, it’s crucial to perform User Testing on the prototypes.
- Gap Analysis is performed to identify all the areas, design hypothesis and assumptions that need validation through testing
- Main tasks and actions are defined which users have to complete to test our design hypothesis and assumptions
- Initial user testing and rapid insights gathering
- Design changes based on user feedback
- Re-run of User Testing to validate that design changes have solved the problem
Step 4: UX Building, Measuring, Learning and Iterating
Final Design Development
Once prototypes are finished, it’s time to prepare the final designs for development. This part consists of:
• Preparation of the Pattern Library (collection of user interface design elements)
• Preparation of the final project visual structure
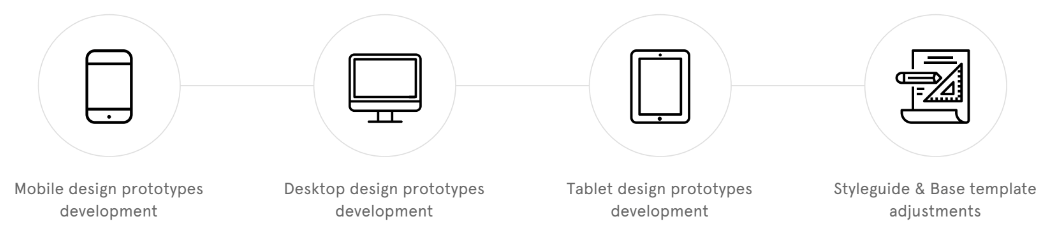
• Preparation of final design source files for visual representation of Mobile, Desktop and Tablet devices main screen resolutions
• User Experience, Functionalities, and User flow design documentation preparation
Design project hand-over to Development team
One of the final steps the Design team has to go through is passing all project information, detailed functionality documentation and design source files to the Development team.
UX/Design/CRO/PM teams that are involved in the project are available for design and User Experience related clarifications also during the development stage of the project and provide any assistance as needed.
Pre-Launch experiments
Before the new shopping user experience and designs fully replace the old, it is strongly recommended to perform A/B testing which essentially validates that the new designs are indeed performing better than the old version.
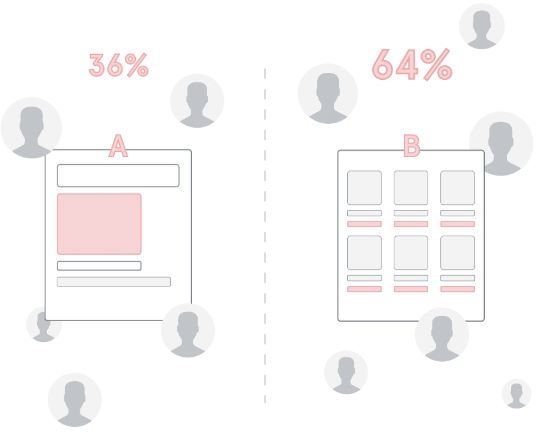
Even the most well-managed redesign projects can have a slow start, hence validating the experience with statistical significance of A/B testing is the best approach.
A key aspect of launching the new user experience and A/B testing is to measure everything and understand the impact of each feature, action, step of the new experience (and site in general). That enables us to identify any issues and iterate if needed.
Post-Launch evaluation
Our Design/UX/CRO teams always follow the performance and success of our projects and perform post-launch data evaluation to determine user behaviour and new experience performance.
During the Analytics and Research part of the project, we also set up Google Data Studio reports for visualised performance metrics dashboards and following the success of the project.
Conclusion
Scandiweb has developed and perfected this workflow over numerous years. This guide was put together, with the hopes that you can find something to supplement your own methods, rather than copy ours. Let’s keep striving to build a better looking and better functioning digital environment!
Let us help you:
Scandiweb has been providing digital solutions since 2003 — if you have any comments, suggestions, want to share your own experience of what works and what doesn’t — get in touch with us at [email protected] and we’ll get back to you shortly, or just visit cro.scandiweb.com to learn more!
Related articles:
- Instant & Smooth Videos for Incredible UX
- User Personas — a way to get to know your customers
- What are conversion optimisation experts talking about besides A/B tests?
- The User Journey — What & Where to Optimize


Share on: