Working with scandiweb has been a really good experience. They were key in our recent project to migrate our Looker Studio dashboards from Universal Analytics to GA4, which included complex product stat tracking. They not only provided us with clear options throughout the process but were also instrumental in helping us understand and fix several underlying tracking issues. Their expertise and efficiency made the entire migration smooth and successful.
Thanks to all the team!:)
Gisela Morinigo
Open Data Product Manager at Global Fishing Watch
When Google announced the end of Universal Analytics (the platform was shut down on July 1, 2024), organizations across every industry were forced to rethink their analytics setups. For many, the transition to Google Analytics 4 (GA4) raised questions like “how to maintain reporting continuity?, “what to do with years of custom dashboards?”
Global Fishing Watch faced these same questions, but their needs weren’t typical. As a nonprofit working to increase transparency on the oceans, their team depends on accurate web and product analytics to support research, policy, and public awareness. We partnered with them to replicate and enhance their business intelligence (BI) setup and ensure it reflects the complexity of their work and supports the people using that data every day.
About
Global Fishing Watch is a nonprofit organization that uses technology to shine light on what’s happening in our oceans, helping create a more transparent and sustainable future for marine life. By tracking fishing vessels and making maritime data publicly accessible, they support efforts to protect marine ecosystems, combat illegal and unreported fishing, inform better policy decisions, and accelerate ocean governance.
With oceans under increasing pressure, their platform is widely used to understand fishing activity in real time. We felt especially proud to support Global Fishing Watch because their mission extends far beyond data toward creating accountability on the water and giving governments, researchers, organizations, and communities the tools they need to safeguard our oceans for generations to come.
Supporting this mission are several public-facing products:
- Map – an interactive platform to visualize and analyze global fishing activity
- Marine Manager – tools to monitor and manage marine protected areas
- Carrier Vessel Portal – data on transshipment activity and carrier vessels
- Vessel Viewer – detailed insights on individual vessel activity
- Data Download Portal – open access to downloadable datasets for research and analysis.
- API Portal – allows to explore, visualize, and freely download Global Fishing Watch data to transform global collaboration and catalyze solutions for complex ocean problems.
Reliable data operations are critical for a mission built on ocean accountability and open access. With the sunset of Universal Analytics (UA), GA4 migration was all about keeping essential information flowing to those working to protect the ocean.
Project goals
Global Fishing Watch had an extensive reporting setup built on UA, with dashboards blending web analytics and backend product data. Their team needed a solution that could replicate and enhance the setup while relying on good-quality data.
Main project goals:
- Conduct a comprehensive audit of the existing tracking and data collection
- Fix legacy issues and set up GA4 using current best practices
- Rebuild UA dashboards with the GA4 data and improve the existing BI dashboards
- Support the internal team during and after the transition to GA4.
Our priority was building a more flexible and future-proof BI setup that could grow with the organization’s needs.
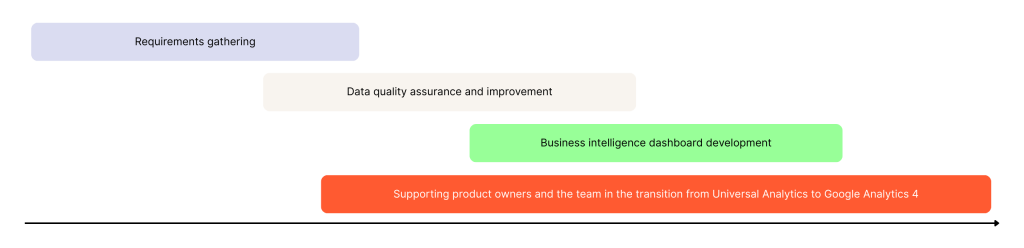
Approach
Global Fishing Watch had multiple data dependencies across products, platforms, and teams. A successful transition meant carefully auditing what was already in place and designing a reporting setup that would remain stable and usable long after Universal Analytics was gone. Let’s look at each of the project stages in the following sections.
Data quality assurance and improvements
The insights are as good as the quality of data. Before rebuilding any dashboards, we performed an audit and made improvements to the tracking setup.
- GA4 property review
- We began with a property-level audit of the GA4 setup to check for configuration issues and gaps in data collection.
- Based on the audit, we reconfigured GA4 settings to follow current best practices and resolved issues affecting reporting accuracy.
- Google Tag Manager (GTM) audit and cleanup
- Since Universal Analytics was being phased out, we removed outdated tags and refined the GTM setup to ensure the best level of data governance.
- Custom dataLayer event development
- We gathered requirements for meaningful user interactions across Global Fishing Watch product pages. These were then implemented as structured dataLayer events to support more granular and relevant reporting in GA4.
Building customized dashboards in Looker Studio
With the data layer improved and GA4 properly configured, we proceeded to rebuild the dashboards. The dashboards relied on the GA4 linked directly to BigQuery, along with backend system data exported to the same warehouse via custom pipelines.
Preparing the data
Query composition
Universal Analytics connected natively to Looker Studio with no quota limits, i.e., the Wild West era of dashboards. GA4, on the other hand, introduced strict limits that kick in with heavy querying, especially with large date ranges, multiple users, or complex filters.
Also read:
How to Overcome GA4 API Limits and Save on Costs
GA4 API Quota Apocalypse and How to Survive It
Note – the limits since then have become much less strict, but you’ll still find our tips above useful!
To bypass these restrictions, we used GA4’s raw BigQuery export. Since this raw data requires additional processing, we built transformation queries to output clean data into dedicated reporting tables. Another data source used in the project was data from the operational system.
Cost control improvement
Google Cloud’s pay-as-you-go model charges for all resource usage. We initially used views for faster development, but needed cost optimization as the project matured.
Key optimizations:
- Switch from views to tables – the biggest cost reduction
- Implement custom upsert logic – daily updates instead of full GA4 re-processing
- Add partitioning and clustering for more efficient queries.
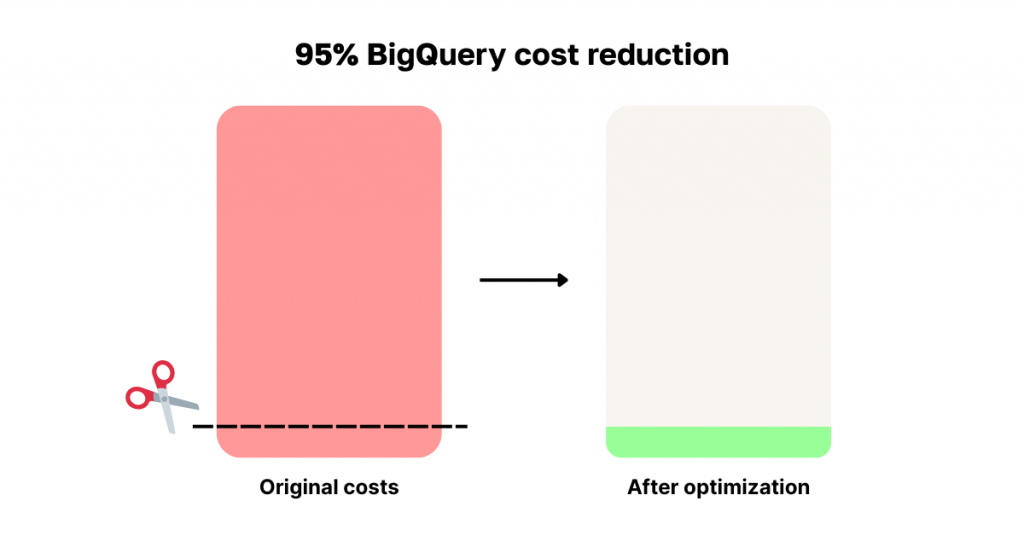
What was once a daily cost during peak usage became the total monthly cost. Proper implementation made a clear difference in how the data pipeline impacted the budget.
Dashboard setup
The dashboard was designed with its key audiences in mind. It consists of aggregated-level pages and product-specific dashboards. On top of that, an executive overview page highlights the most important metrics and timelines for leadership.
🚀 Quick takeaway
While Looker Studio is a relatively simple, lightweight BI tool, many people don’t realize how customizable it can be!
Customizations
- Brand guidelines
- We styled the dashboard using Global Fishing Watch’s brand guidelines (colors, fonts, icons) to ensure consistency with the company’s visual identity.
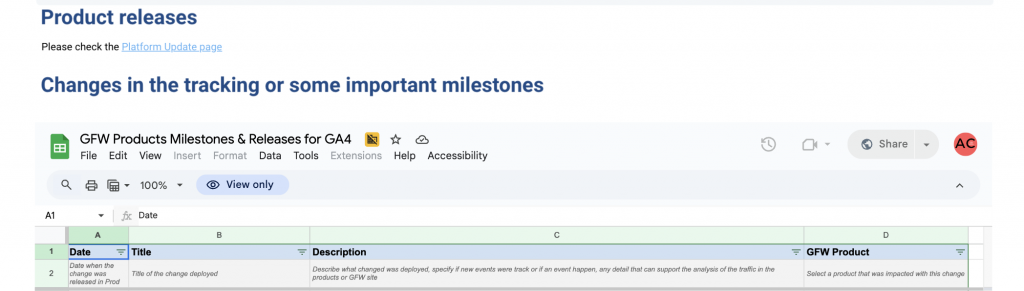
- Product milestones
- Sometimes you notice a data change but can’t immediately tell whether it’s expected or tied to a product update. To solve this, we embedded a Google Sheet that logs major deployments and changes.
- Dashboard usage guides
- Not all user groups are equally familiar with BI tools, and that’s okay. To make the dashboard easier to navigate, we added a built-in guide that walks users through the report’s main and hidden functionalities.
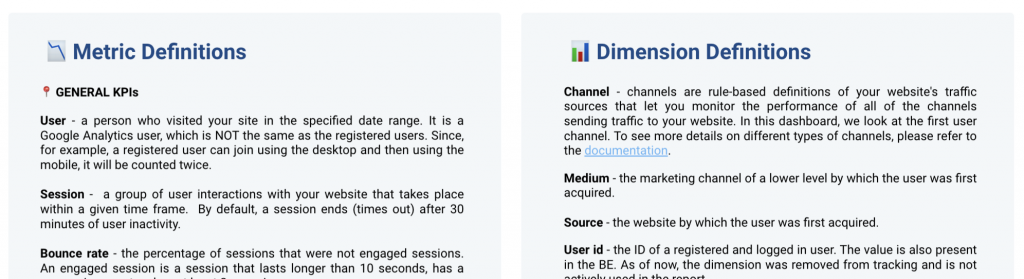
- Glossary
- Some teams work less frequently with web analytics. To make interpretation easier, we created a glossary page explaining how key metrics are calculated and what each data source represents.
- Filtering internal staff
- We added a simple button that allows users to filter out traffic from Global Fishing Watch employee accounts. Buttons are often underused in Looker Studio!
Summary of dashboard specifics
- Multiple dashboard sections for different stakeholder groups
- KPI glossary and dashboard usage guidelines
- Embedded sheet with product deployment context
- Styling according to brand guidelines
- Ability to exclude internal traffic.
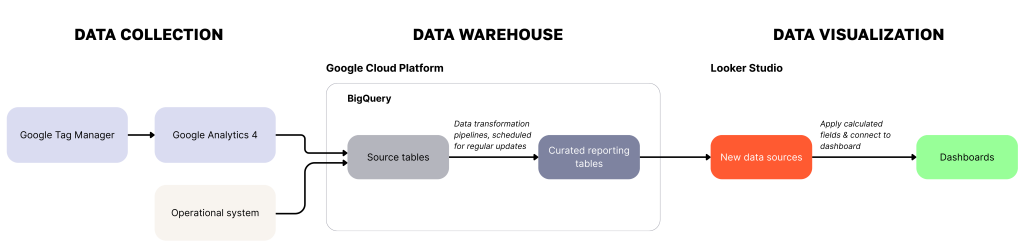
Solution architecture
Below is the final solution architecture, which illustrates how data moves from collection to visualization. Web and operational data flow into BigQuery as source tables and are transformed into curated reporting tables through scheduled pipelines.
These reporting tables feed into Looker Studio, where new calculated fields can be applied and dashboards are built for clear, actionable insights. The setup ensures reliable data, efficient reporting, and a sustainable foundation for future analysis.
Results
With Universal Analytics sunset, Global Fishing Watch’s web tracking was successfully aligned with GA4 best practices. The BI reporting setup transitioned smoothly to GA4 data, with enhancements to the user experience and content while ensuring resource efficiency.
Their team now benefits from:
- Clean, accurate data tailored to their needs
- Custom GA4 dashboards delivered quickly to meet the UA sunset, tailored to different levels of expertise
- An optimized reporting pipeline that reduces cloud costs.
We wanted to acknowledge that the Global Fishing Watch team also played an important role throughout the project, sharing input, context, and technical support that contributed to the successful outcome.
The project concluded with a workshop for the GFW team on how to use and adapt their new setup. Since then, our collaboration has continued, with ongoing support for analytics-related questions and requests.
Working with Global Fishing Watch has been meaningful and rewarding for us personally – not only because of the technical challenge, but because of the impact their mission has on ocean transparency and sustainability.
Need help with dashboards that fit your data and your goals? We help teams create fully customized reporting solutions. Request a free consultation, and one of our experts will get back to you shortly!

Share on: