

Every eCommerce platform says it’s fast, and every vendor has a demo store that loads in a blink. A demo can’t show how a platform performs across thousands of real stores, with real catalogs, real hosting and real shoppers on their phones. That’s usually the question behind a search for the fastest eCommerce platform: before you choose a platform, or blame the one you run, you want to know how fast stores on it really are.
scandiweb looked at the first thing every shopper waits for: time to first byte (TTFB), how long a store’s server takes to start sending a page. Until that first byte arrives, the screen stays blank. We compared 12 eCommerce platforms on the Chrome UX Report, Google’s dataset of real visits from Chrome users, for September 2026, and checked whether the differences hold for sites of the same size, in different countries and over the past three years.
Key findings
Seven numbers summarize the study. Each one comes from scandiweb’s analysis of Chrome UX Report data, served through the HTTP Archive Tech Report, for September 2026 and for the three Septembers before it. Unless a finding says otherwise, every figure is the share of sites whose 75th-percentile mobile time to first byte was 800 ms or less.
- scandiweb’s analysis of Chrome UX Report data for September 2026 found that 83.8% of Shopify sites (n = 430,634) gave mobile visitors a good time to first byte, the highest share of the 12 eCommerce platforms compared.
- In the same September 2026 data, 23.0% of Magento sites (n = 31,799) had a good mobile time to first byte, ranking Magento 10th of 12 platforms, ahead of WooCommerce (12.1%, n = 519,794) and VTEX (4.8%, n = 3,198).
- The median Magento site’s 75th-percentile mobile time to first byte fell between 1,200 and 1,299 ms in September 2026, more than twice the 500–599 ms of the median Shopify site, according to scandiweb’s analysis.
- Among the 100,000 most visited sites, 23.0% of Magento sites (n = 739) had a good mobile time to first byte in September 2026, against 78.9% of Shopify sites (n = 1,829), scandiweb found.
- Magento sites built with the Hyvä theme passed all three Core Web Vitals on mobile 66.4% of the time in September 2026 (n = 4,593), against 44.6% for Magento overall, but their good time-to-first-byte share was 23.2%, almost the same as Magento’s 23.0%.
- Between September 2023 and September 2026, the share of Magento sites with a good mobile time to first byte rose from 16.1% to 23.0%, while Shopify’s rose from 78.1% to 83.8%, scandiweb’s trend analysis of Chrome UX Report data shows.
- For visitors in the United States in September 2026, 13.7% of Magento sites had a good mobile time to first byte, against 88.9% of Shopify sites, the widest gap of the three countries scandiweb checked.
How scandiweb measured eCommerce platform speed
scandiweb pulled Chrome UX Report field data for 12 eCommerce platforms and for all websites from the HTTP Archive Tech Report API on October 29, 2026. September 2026 is the snapshot month, and September 2023 to September 2026 is the trend. The main measure is the share of sites whose 75th-percentile time to first byte was 800 ms or less, with mobile and desktop counted separately.
The 12 platforms are Shopify, Webflow, Squarespace, Wix, BigCommerce, SAP Commerce Cloud, Shopware, Salesforce Commerce Cloud, PrestaShop, Magento, WooCommerce and VTEX. Magento sites running the Hyvä theme appear as a separate row, and “All websites” is the reference row for every site with Chrome data.
The instrument is the HTTP Archive Tech Report. It serves Chrome UX Report field data aggregated per technology, where the technology is detected by HTTP Archive’s monthly crawl using Wappalyzer rules. The API is public and needs no key, and its methodology is documented on GitHub. The pull took 104 calls with 0 failures.
Each site counts once, by its 75th-percentile value over a 28-day window. A site has a good time to first byte when that value is 800 ms or less, which means the server started responding within 0.8 seconds on at least three out of four visits. Google’s TTFB guidance calls 0.8 seconds or less good and more than 1.8 seconds poor.
A site passes Core Web Vitals when its 75th-percentile Largest Contentful Paint, Interaction to Next Paint and Cumulative Layout Shift are all good. The Web Vitals thresholds are 2.5 seconds, 200 milliseconds and 0.1. In the Chrome UX Report methodology, TTFB is listed as an experimental metric and is only collected on full page loads.
Popularity tiers use the Chrome UX Report rank: the top 1 million, 100,000, 10,000 and 1,000 origins. Where a tier has a small sample, its n is reported next to the figure. Cells with fewer than 20 sites are shown as counts rather than percentages.
Country means where the visitor was, as recorded by Chrome. It says nothing about where the store is hosted.
Which eCommerce platform is fastest?
Shopify, Webflow, Squarespace and Wix lead on server response. In September 2026, 83.8% of Shopify sites gave mobile visitors a good time to first byte, followed by Webflow at 77.5%, Squarespace at 76.6% and Wix at 73.1%. Magento ranks 10th of 12 at 23.0%, and only WooCommerce (12.1%) and VTEX (4.8%) are lower. The figure for all websites with Chrome data is 45.9%.
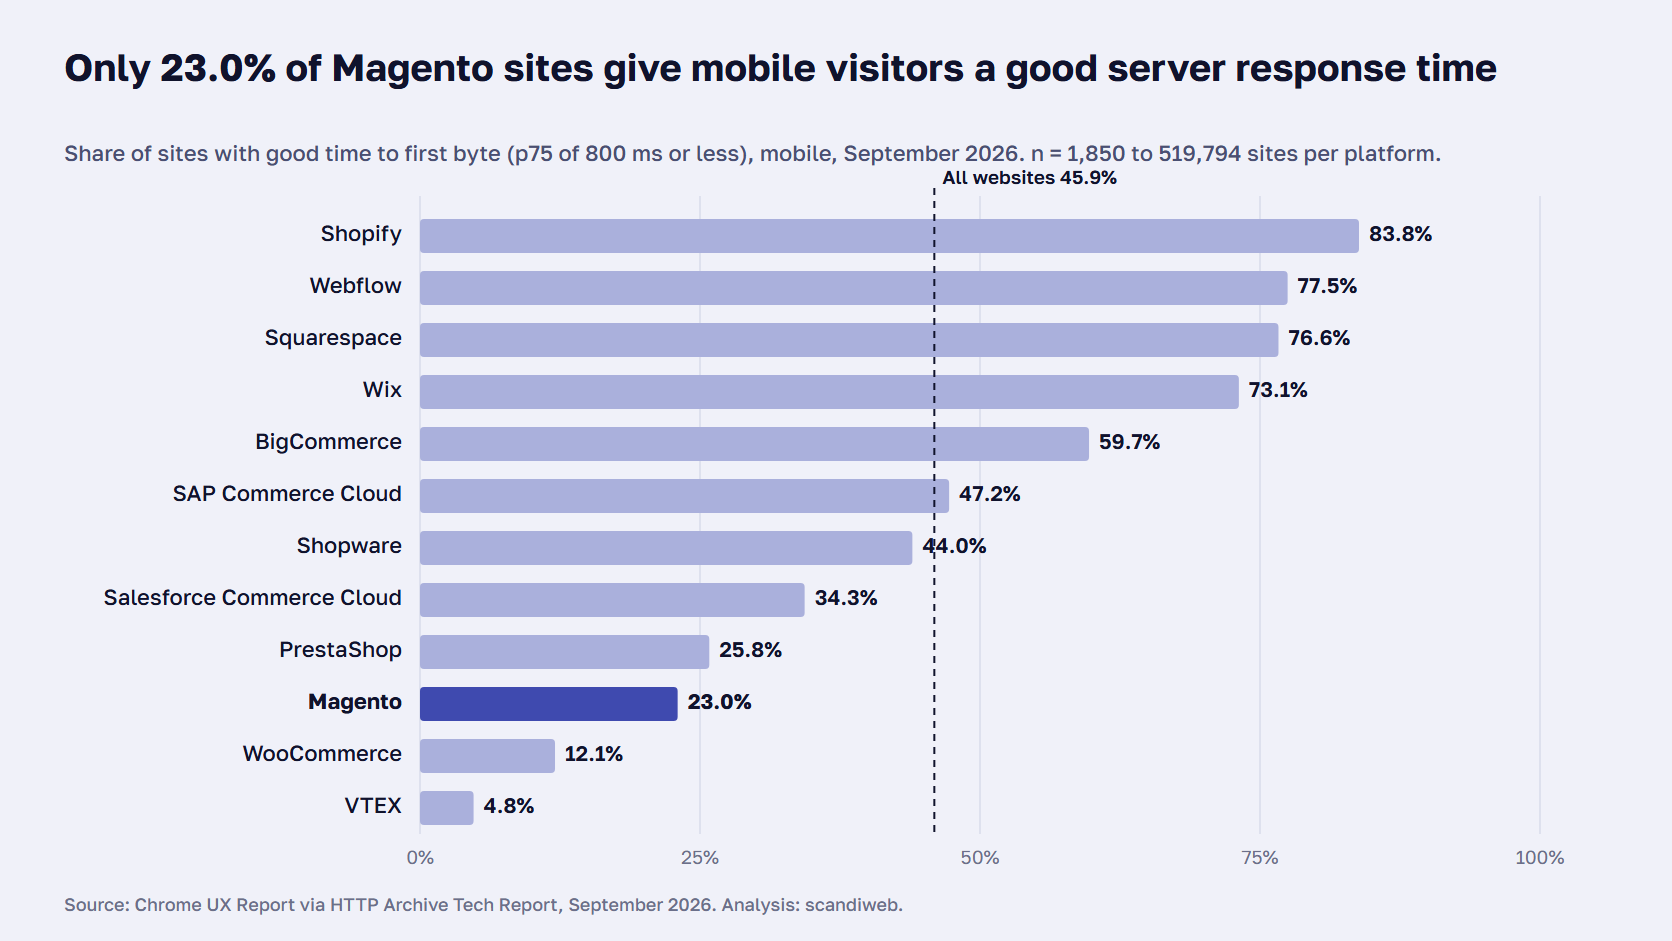
| Platform | Good TTFB, mobile | Good TTFB, desktop | CWV pass, mobile | CWV pass, desktop | Good LCP, mobile | Good INP, mobile | Good CLS, mobile | Origins tested (mobile TTFB) |
|---|---|---|---|---|---|---|---|---|
| Shopify | 83.8% | 92.6% | 76.2% | 79.5% | 87.7% | 86.7% | 92.4% | 430,634 |
| Webflow | 77.5% | 94.1% | 71.5% | 83.4% | 77.8% | 89.3% | 94.5% | 7,908 |
| Squarespace | 76.6% | 89.9% | 71.0% | 76.1% | 78.0% | 97.3% | 89.5% | 83,353 |
| Wix | 73.1% | 67.7% | 79.5% | 85.5% | 83.3% | 92.2% | 97.9% | 112,516 |
| BigCommerce | 59.7% | 78.6% | 62.5% | 55.6% | 83.6% | 96.7% | 73.1% | 11,360 |
| SAP Commerce Cloud | 47.2% | 58.4% | 36.1% | 36.1% | 63.7% | 74.9% | 57.3% | 1,850 |
| All websites | 45.9% | 58.2% | 52.8% | 60.8% | 65.6% | 79.4% | 83.4% | 8,345,086 |
| Shopware | 44.0% | 49.6% | 84.0% | 79.8% | 90.4% | 96.6% | 94.2% | 8,239 |
| Salesforce Commerce Cloud | 34.3% | 46.2% | 38.4% | 45.1% | 72.3% | 61.4% | 66.5% | 3,666 |
| PrestaShop | 25.8% | 32.5% | 61.4% | 62.3% | 73.6% | 90.4% | 85.8% | 47,678 |
| Magento with Hyvä | 23.2% | 23.7% | 66.4% | 61.7% | 77.2% | 90.2% | 89.5% | 4,593 |
| Magento | 23.0% | 22.7% | 44.6% | 45.6% | 58.1% | 84.4% | 70.9% | 31,799 |
| WooCommerce | 12.1% | 12.4% | 39.3% | 39.3% | 43.5% | 91.4% | 88.7% | 519,794 |
| VTEX | 4.8% | 8.3% | 3.9% | 4.9% | 8.7% | 39.3% | 24.2% | 3,198 |
The four leaders have one thing in common. Shopify, Webflow, Squarespace and Wix all run every store on the vendor’s own infrastructure, so the merchant never picks a host, a cache or a server size. That is an observation, and the data doesn’t show that it is the cause. Hosting, CDN use and the size of a typical store all differ between platforms, and this study can’t separate those factors.
Desktop numbers follow the same order with higher values. 92.6% of Shopify sites and 94.1% of Webflow sites have a good desktop time to first byte, against 22.7% of Magento sites. Wix is the exception, with a lower desktop share (67.7%) than mobile (73.1%).
Magento’s position is specific. It is 10th of 12, and the data doesn’t support calling it the slowest. WooCommerce, which includes hundreds of thousands of small sites, and VTEX are both lower. If the platform choice itself is on the table, our comparison of Magento and Shopify beyond speed covers catalog size, B2B needs and customization.
Does the gap hold for sites of the same size?
Yes. Among the 1 million most visited sites, 20.5% of Magento sites (n = 7,956) had a good mobile time to first byte, against 85.7% of Shopify sites (n = 47,951). Among the top 100,000, the figures are 23.0% for Magento (n = 739) and 78.9% for Shopify (n = 1,829). Only in the top 10,000 does the gap narrow, and that cell holds 29 Magento sites.
| Platform | ALL | Top 1M | Top 100k | Top 10k | Top 1k |
|---|---|---|---|---|---|
| Shopify | 83.8% | 85.7% | 78.9% | 64.3% (n=42) | 0 of 1 |
| Webflow | 77.5% | 74.6% | 11 of 19 | – | – |
| Squarespace | 76.6% | 70.2% | 7 of 10 | – | – |
| Wix | 73.1% | 61.2% | 9 of 11 | 1 of 1 | – |
| BigCommerce | 59.7% | 80.3% | 81.1% (n=53) | – | – |
| SAP Commerce Cloud | 47.2% | 40.7% | 38.4% | 40.0% (n=20) | – |
| All websites | 45.9% | 54.9% | 61.6% | 67.8% | 67.2% |
| Shopware | 44.0% | 35.3% | 39.1% (n=23) | 1 of 1 | – |
| Salesforce Commerce Cloud | 34.3% | 32.8% | 33.3% | 30.0% (n=40) | – |
| PrestaShop | 25.8% | 23.3% | 26.2% | 1 of 1 | – |
| Magento with Hyvä | 23.2% | 21.8% | 16.5% | 1 of 3 | – |
| Magento | 23.0% | 20.5% | 23.0% | 37.9% (n=29) | – |
| WooCommerce | 12.1% | 14.8% | 34.8% | 5 of 7 | – |
| VTEX | 4.8% | 5.6% | 9.8% | 3 of 9 | – |
The popularity cut was the main test of whether the ranking is an artifact of site size. A platform full of small hobby stores could look slow because of its sites, and a platform full of large stores could look fast for the same reason. Comparing sites of similar popularity removes much of that.
The gap survived the test. For all websites, the good-TTFB share rises with popularity, from 45.9% overall to 54.9% in the top 1 million and 61.6% in the top 100,000. Magento does not follow that curve until the top 10,000, where it reaches 37.9% against Shopify’s 64.3%, a gap of 26.4 points.
BigCommerce is the one platform where the popularity cut changes the picture. Its overall share is 59.7%, but among the top 100,000 sites it reaches 81.1% (n = 53), above Shopify’s 78.9% in the same tier.
🚀 Quick takeaway
Compare your store with sites of a similar size, not with the platform average. A top-100k Magento store should be measured against the 23.0% in that tier, and a top-10k store against 37.9%.
How long does a typical store take to respond?
The median Magento site’s 75th-percentile mobile time to first byte fell in the 1,200–1,299 ms bucket in September 2026. The median Shopify site fell in 500–599 ms, so Magento’s figure is more than twice as long. The median for all websites was 800–899 ms, just outside the 800 ms line that counts as good.
| Platform | Mobile, all sites | Desktop, all sites | Mobile, top 100k | Origins (mobile, all) |
|---|---|---|---|---|
| Shopify | 500–599 ms | 400–499 ms | 500–599 ms | 430,635 |
| Wix | 500–599 ms | 500–599 ms | 400–499 ms | 112,520 |
| Squarespace | 500–599 ms | 400–499 ms | 700–799 ms | 83,356 |
| Webflow | 500–599 ms | 300–399 ms | 500–599 ms | 7,910 |
| BigCommerce | 700–799 ms | 600–699 ms | 400–499 ms | 11,359 |
| All websites | 800–899 ms | 600–699 ms | 600–699 ms | 8,301,496 |
| SAP Commerce Cloud | 800–899 ms | 700–799 ms | 900–999 ms | 1,850 |
| Shopware | 800–899 ms | 800–899 ms | 800–899 ms | 8,239 |
| Salesforce Commerce Cloud | 900–999 ms | 800–899 ms | 900–999 ms | 3,666 |
| PrestaShop | 1,000–1,099 ms | 1,000–1,099 ms | 1,000–1,099 ms | 47,656 |
| Magento with Hyvä | 1,100–1,199 ms | 1,100–1,199 ms | 1,200–1,299 ms | 4,593 |
| Magento | 1,200–1,299 ms | 1,200–1,299 ms | 1,200–1,299 ms | 31,783 |
| WooCommerce | 1,700–1,799 ms | 1,600–1,699 ms | 1,000–1,099 ms | 519,180 |
| VTEX | 1,900–1,999 ms | 1,700–1,799 ms | 1,300–1,399 ms | 3,198 |
These are ranges because the Chrome UX Report publishes TTFB as a histogram in 100 ms buckets. The median is the bucket that the middle site falls into, so a Magento store at the median had a 75th-percentile TTFB somewhere between 1,200 and 1,299 ms. The exact millisecond isn’t available.
The shape matters as much as the median. Four hosted platforms share the 500–599 ms bucket on mobile. Magento, PrestaShop and Hyvä stores cluster above one second, and WooCommerce and VTEX medians are above 1.7 seconds, close to the 1.8 second line that Google calls poor.
Site size changes the median for some platforms and not for Magento. Among the top 100,000 sites, the median WooCommerce store improves to 1,000–1,099 ms and BigCommerce to 400–499 ms. The median Magento store stays at 1,200–1,299 ms, the same bucket as across all sites.
Why do some platforms pass Core Web Vitals with a slow server?
Because Core Web Vitals and time to first byte measure different things. Shopware sites pass all three Core Web Vitals most often of the 12 platforms, at 84.0%, yet only 44.0% of them have a good time to first byte. Magento sites on Hyvä pass Core Web Vitals 66.4% of the time, against 44.6% for Magento overall, while their good-TTFB share is 23.2%, almost identical to Magento’s 23.0%.
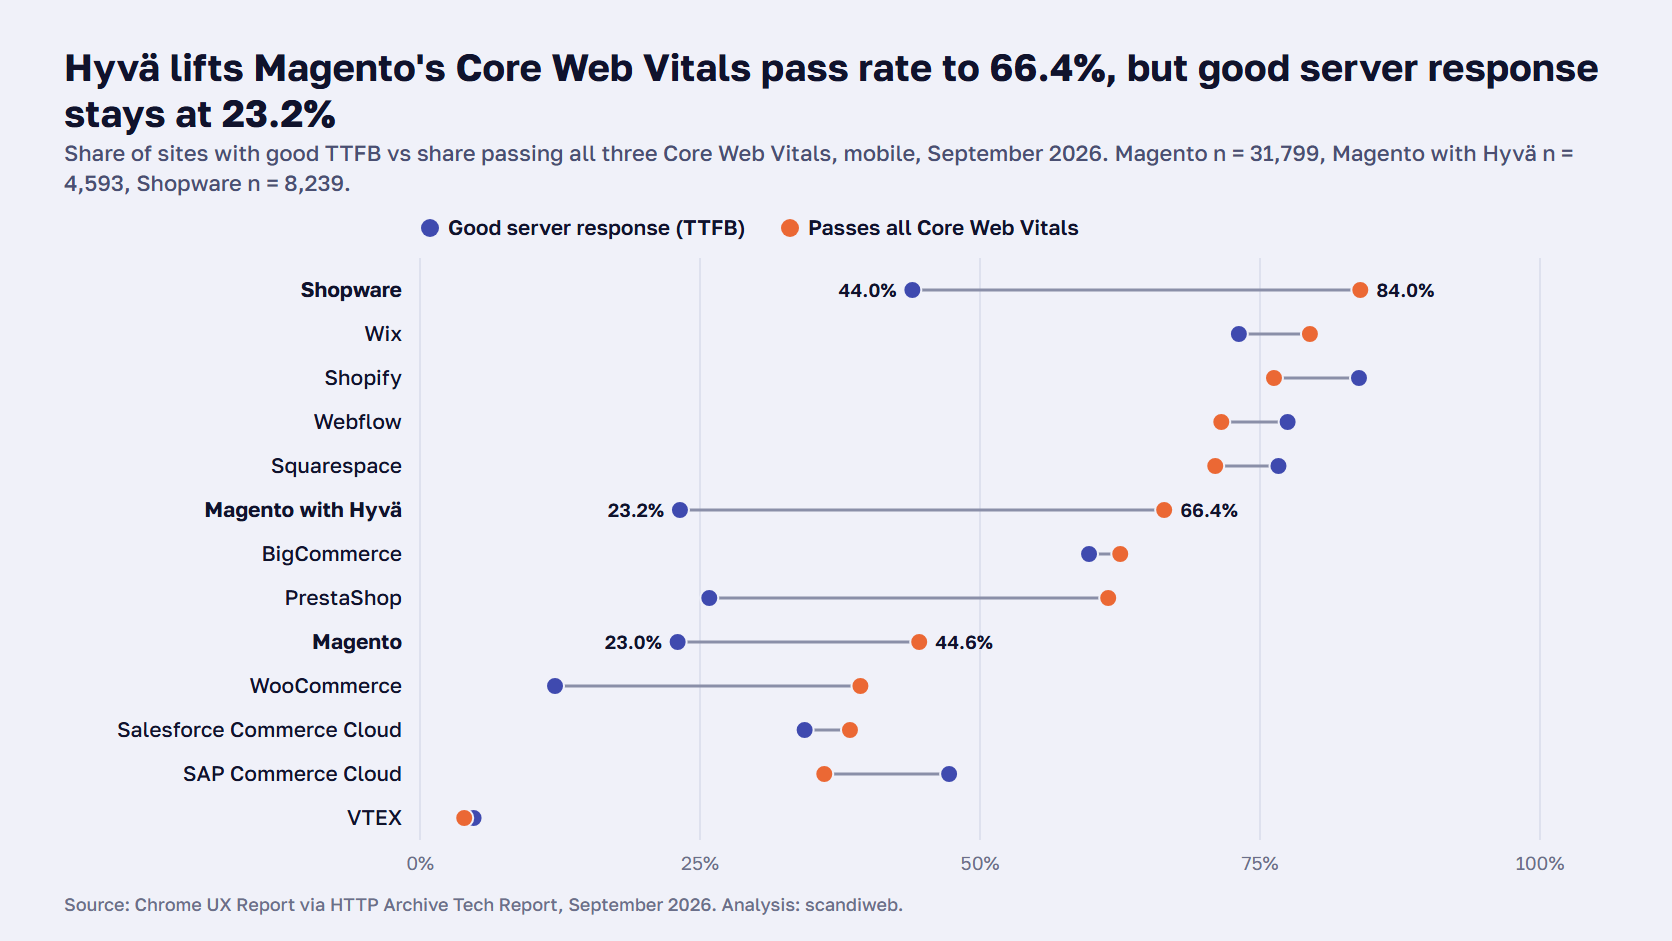
TTFB isn’t a Core Web Vital. Google’s TTFB article states that because it isn’t one of the three, a site doesn’t have to meet the good threshold to pass. The three vitals measure what the shopper sees and feels after the first byte arrives: how fast the largest element paints, how quickly taps get a response, and how much the layout jumps.
The Hyvä rows show what that split means for a Magento store. Hyvä is a frontend theme, and the frontend work moved the Core Web Vitals pass rate from 44.6% to 66.4% and left server response where it was. The same pattern holds for Lighthouse, where the median Hyvä store scores 48 against 35 for Magento overall. If a Hyvä project is on your plan, our guide on how to work with Hyvä covers what it changes and what it doesn’t.
| Platform | Lighthouse performance, mobile | JavaScript, mobile | Total page, mobile | Origins Sep 2023 → Sep 2026 (mobile) |
|---|---|---|---|---|
| Shopify | 48 | 2,288 KB | 4,015 KB | 323,755 → 452,270 |
| Webflow | 59 | 1,192 KB | 4,044 KB | 6,666 → 8,417 |
| Squarespace | 30 | 1,495 KB | 3,571 KB | 100,253 → 92,762 |
| Wix | 60 | 1,928 KB | 2,995 KB | 115,955 → 123,133 |
| BigCommerce | 37 | 1,098 KB | 2,896 KB | 15,475 → 11,787 |
| SAP Commerce Cloud | 29 | 1,568 KB | 4,172 KB | 2,878 → 1,888 |
| All websites | 48 | 732 KB | 2,564 KB | 9,992,628 → 8,739,300 |
| Shopware | 39 | 606 KB | 3,240 KB | 13,620 → 8,649 |
| Salesforce Commerce Cloud | 31 | 1,674 KB | 4,701 KB | 4,744 → 3,701 |
| PrestaShop | 34 | 850 KB | 2,832 KB | 74,749 → 49,565 |
| Magento with Hyvä | 48 | 767 KB | 2,247 KB | 1,158 → 4,696 |
| Magento | 35 | 1,270 KB | 3,390 KB | 52,651 → 32,588 |
| WooCommerce | 37 | 811 KB | 2,948 KB | 650,543 → 553,677 |
| VTEX | 42 | 2,092 KB | 3,774 KB | 4,237 → 3,230 |
The JavaScript column makes the same point from the other direction. The median Shopify site loads 2,288 KB of JavaScript on mobile, the most of the 12 platforms, and still has the best time to first byte. TTFB is measured before any script runs, so the amount of JavaScript a page carries has no effect on it.
Shopware is the opposite case. Its median page carries 606 KB of JavaScript, the least of the 12, which fits its 84.0% Core Web Vitals pass rate. Its server response is close to the all-websites average.
🚀 Quick takeaway
Passing Core Web Vitals doesn’t mean the server is fast. Check TTFB separately, because a store can show green vitals in Search Console while its server takes more than a second to respond.
Has Magento’s server response improved since 2023?
Yes, mostly in the last year. The share of Magento sites with a good mobile time to first byte was 16.1% in September 2023, 16.7% in 2024, 16.6% in 2025 and 23.0% in 2026. Magento’s Core Web Vitals pass rate doubled over the same period, from 22.2% to 44.6%. Shopify went from 78.1% to 83.8%, so the gap between the two stayed close to 60 points.
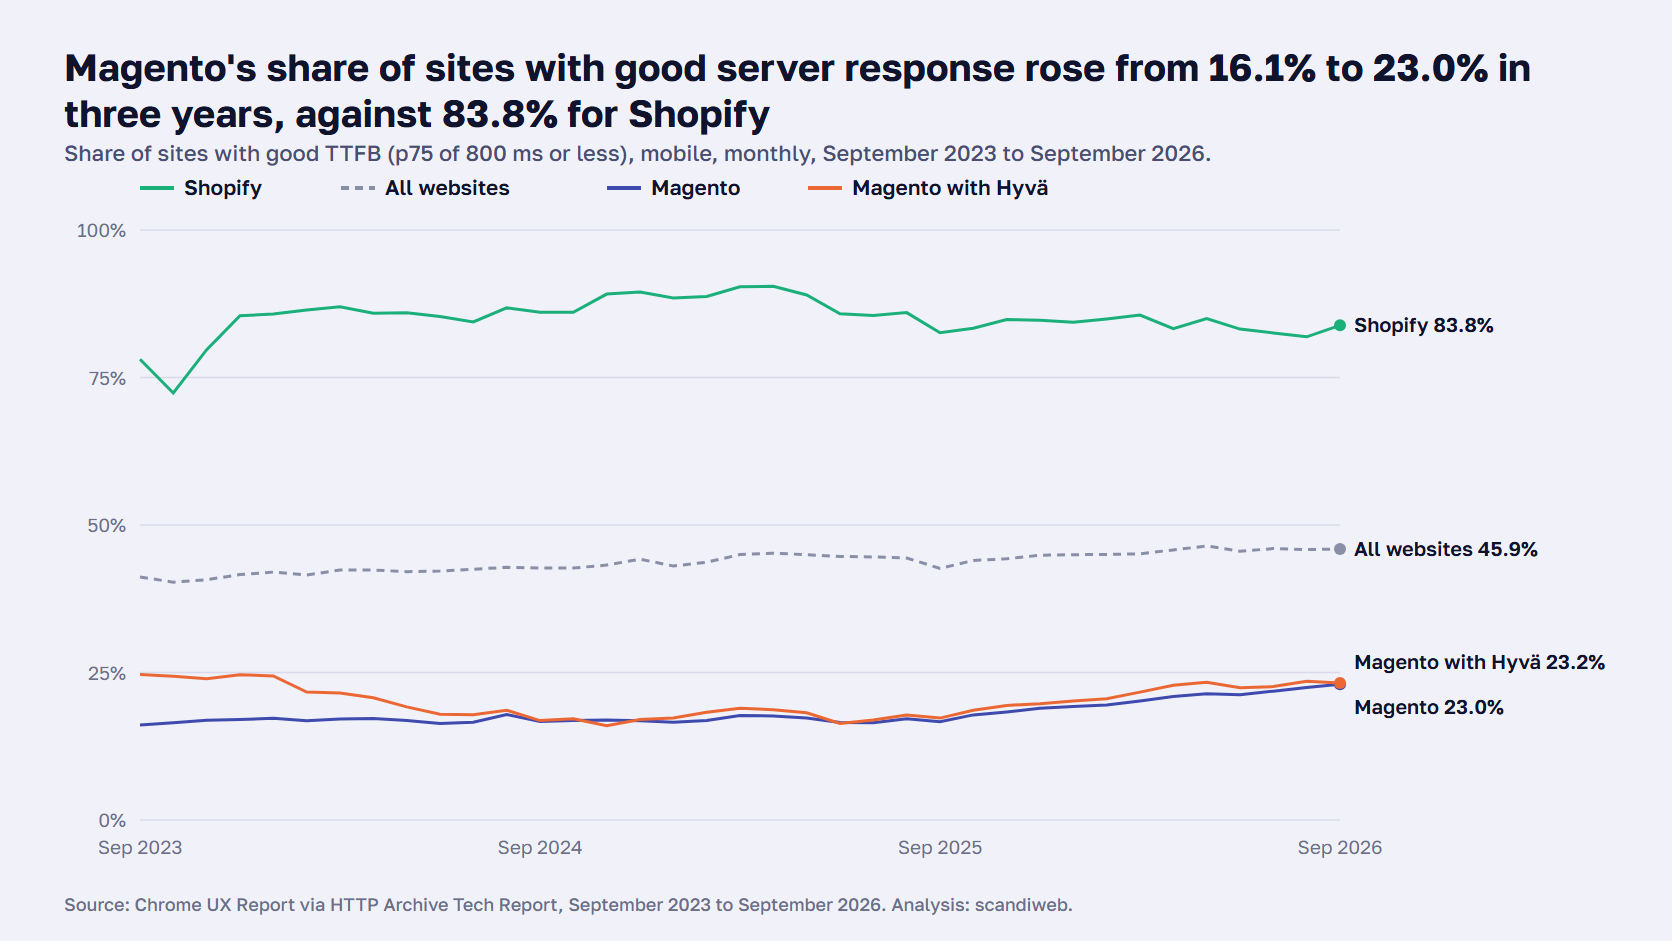
| Platform | TTFB 2023 | TTFB 2024 | TTFB 2025 | TTFB 2026 | CWV 2023 | CWV 2024 | CWV 2025 | CWV 2026 |
|---|---|---|---|---|---|---|---|---|
| Shopify | 78.1% | 86.0% | 82.6% | 83.8% | 59.5% | 71.8% | 76.2% | 76.2% |
| Webflow | 35.2% | 40.2% | 40.1% | 77.5% | 47.1% | 57.9% | 61.8% | 71.5% |
| Squarespace | 73.7% | 73.6% | 79.1% | 76.6% | 41.5% | 62.2% | 65.0% | 71.0% |
| Wix | 69.4% | 38.7% | 52.2% | 73.1% | 47.9% | 57.8% | 69.4% | 79.5% |
| BigCommerce | 13.2% | 58.6% | 57.1% | 59.7% | 39.4% | 55.6% | 61.6% | 62.5% |
| SAP Commerce Cloud | 38.2% | 41.2% | 45.6% | 47.2% | 19.4% | 20.7% | 30.3% | 36.1% |
| All websites | 41.2% | 42.7% | 42.6% | 45.9% | 43.2% | 48.1% | 50.5% | 52.8% |
| Shopware | 35.2% | 35.2% | 34.6% | 44.0% | 70.7% | 76.0% | 78.5% | 84.0% |
| Salesforce Commerce Cloud | 20.8% | 22.7% | 26.2% | 34.3% | 21.1% | 23.9% | 35.6% | 38.4% |
| PrestaShop | 18.9% | 21.5% | 22.3% | 25.8% | 39.0% | 44.0% | 55.9% | 61.4% |
| Magento with Hyvä | 24.7% | 16.9% | 17.3% | 23.2% | 51.4% | 48.8% | 62.2% | 66.4% |
| Magento | 16.1% | 16.7% | 16.6% | 23.0% | 22.2% | 26.4% | 39.2% | 44.6% |
| WooCommerce | 13.6% | 13.9% | 12.4% | 12.1% | 23.0% | 31.5% | 35.6% | 39.3% |
| VTEX | 2.3% | 1.7% | 2.3% | 4.8% | 2.9% | 4.3% | 4.6% | 3.9% |
The gap to Shopify was 62.0 points in September 2023 and 60.8 points in September 2026. Magento gained 6.9 points on server response over three years, and Shopify gained 5.7, so the distance between them barely moved. All websites gained 4.7 points over the same period.
The Core Web Vitals trend is different. Magento’s pass rate rose every year, from 22.2% to 26.4%, 39.2% and 44.6%. Most of that came from the browser side, which is the same pattern the Hyvä rows show in a single snapshot.
Two hosted platforms made large jumps in a single year. Webflow went from 40.1% to 77.5% between September 2025 and September 2026, and BigCommerce from 13.2% to 58.6% between 2023 and 2024. The data records the change and doesn’t say what caused it.
The adoption figures in Table 6 are context, and they are detection counts rather than market share. HTTP Archive detected Magento on 52,651 mobile origins in September 2023 and 32,588 in September 2026, a drop of 38.1%. Over the same period, Hyvä detections rose from 1,158 to 4,696, about four times as many, and Shopify from 323,755 to 452,270, up 39.7%.
Those counts depend on which sites have enough Chrome traffic to be included and on what the crawl can detect from a homepage. A store that moved to a headless frontend usually stops being detected as Magento even though the backend hasn’t changed.
Does the gap change by country?
The size of the gap changes, and the direction doesn’t. For visitors in the United States, 13.7% of Magento sites had a good mobile time to first byte against 88.9% of Shopify sites. In the United Kingdom the figures are 26.7% and 94.1%, and in Germany 33.0% and 91.9%. Magento’s best country in the set, Germany, still trails Shopify’s weakest country, the United States, by 55.9 points.
| Platform | United States | United Kingdom | Germany |
|---|---|---|---|
| Shopify | 88.9% | 94.1% | 91.9% |
| Webflow | 85.8% | 89.4% | 89.0% |
| Squarespace | 93.0% | 96.6% | 94.7% |
| Wix | 82.3% | 92.5% | 92.1% |
| BigCommerce | 72.6% | 82.3% | 56.3% |
| SAP Commerce Cloud | 41.5% | 48.7% | 57.1% |
| All websites | 54.8% | 61.6% | 58.8% |
| Shopware | 6.2% | 33.8% | 49.4% |
| Salesforce Commerce Cloud | 31.0% | 39.5% | 41.4% |
| PrestaShop | 10.4% | 29.4% | 27.8% |
| Magento with Hyvä | 11.9% | 28.2% | 30.9% |
| Magento | 13.7% | 26.7% | 33.0% |
| WooCommerce | 17.8% | 20.4% | 20.1% |
| VTEX | 4.4% | 14.8% (n=27) | 10.0% (n=40) |
The country in this table is where the visitor was, as Chrome recorded it. It is a cut of the same sites by who visited them, so a store with shoppers in several countries appears in more than one column.
Distance is part of time to first byte. TTFB includes the DNS lookup, the connection, the TLS handshake and the trip between the visitor and the server, so a store hosted far from its shoppers pays for that distance on every page view before the server has done any work.
Shopware is the clearest case in the table. For visitors in Germany, 49.4% of Shopware sites respond fast, against 6.2% for visitors in the United States. The data doesn’t record where those sites are hosted, but the pattern is what distance would produce.
For Magento the spread is smaller. Its best figure, 33.0% in Germany, is still below the all-websites average in every column, so distance alone doesn’t explain where Magento stands.
🚀 Quick takeaway
Test from where your shoppers are. Distance shows up in TTFB, and a server that responds in 400 ms from the same city can be well past 800 ms from another continent.
What this means for Magento stores
The rest of this section is interpretation. The data shows which sites respond fast, and the reasoning about why, and about what to do, is ours. On Magento, most of the gap to the hosted platforms is server response, the part of the wait that happens before the browser has received anything to draw.
Frontend projects lift Core Web Vitals and don’t move TTFB. The Hyvä rows show it in a snapshot, and Magento’s trend shows it over three years: the Core Web Vitals pass rate doubled while the share with good server response moved 6.9 points. A theme changes what the browser does once the page arrives.
Server response moves with server work. The levers are how much of your traffic the full page cache covers, where and how the store is hosted, and how long Magento takes to build a page the cache doesn’t hold. The last one is where most Magento stores still lose time, because logged-in customers, filtered category pages, search results and the first visit after a deploy all miss the cache more often. Our guide to why a Magento site gets slow covers the other causes.
Expedio is scandiweb’s module that speeds up how Magento builds each page on the server. The page build is at least 2x faster, so the same server handles 3x the traffic before response times start to rise. It works with Luma, Hyvä or a custom theme and leaves the theme and the data as they are. How we measured that is in the Expedio benchmark.

A faster page build doesn’t close the whole gap to Shopify on its own. TTFB also includes network time, from the DNS lookup to the distance between the visitor and the server, and no module changes that. Hosting location, a CDN in front of the store and the cache hit rate each decide part of the number.
If you want to work through the layers in order, our guide on how to speed up Magento covers server, caching, database and frontend fixes, and our post on how to reduce initial server response time covers the diagnostics. Auditing your store’s performance measures where your store’s time goes before you commission any of it.
🚀 Quick takeaway
The gap is the work done before the first byte, which is where Magento stores can still gain the most. Measure TTFB on a filtered category page while logged in, then compare it with the cached homepage.
What we expected and did not find
Two expectations didn’t hold. We expected Hyvä stores to show some server-side gain, and they don’t. We expected the gap to Shopify to disappear among the 10,000 most visited sites, and it narrows without closing. Both results point the same way: server response on Magento depends on server work, and neither a newer frontend nor a larger site changes that on its own.
The Hyvä expectation came from how those stores are built. Hyvä stores tend to be newer builds, often on newer hosting, so some server-side gain seemed likely. The data shows 23.2% with a good mobile time to first byte against 23.0% for Magento overall, and the median Hyvä store responds one bucket faster, at 1,100–1,199 ms against 1,200–1,299 ms.
The top-tier expectation came from the all-websites curve, where the share of fast sites rises with popularity. Among the top 10,000 sites, 37.9% of Magento stores (n = 29) respond fast against 64.3% of Shopify stores (n = 42). That is a gap of 26.4 points on a small sample, and it is still a gap.
🚀 Quick takeaway
A new theme changes what the browser does. It doesn’t change how fast Magento starts sending the page, so budget a server project alongside any Hyvä migration.
Limitations
This study describes which sites respond fast in Chrome’s field data. It doesn’t explain why, and it doesn’t prove that the platform causes the difference. The six limitations below apply to every number in this article, and each one should be read before any figure is quoted.
Chrome only
The Chrome UX Report covers real Chrome users who opted in to usage statistics, and only origins with enough traffic to be included. Safari and Firefox visits aren’t in it, and a store whose shoppers are mostly on iPhones is represented by its Chrome visitors alone.
Origin level, homepage detection
Each site counts once, by its 75th-percentile time to first byte over a 28-day window. Platforms are detected by HTTP Archive’s crawl, using Wappalyzer rules, from the homepage. Some stores may be misclassified. Headless storefronts usually aren’t detected as their backend platform. “Magento” includes both Magento Open Source and Adobe Commerce.
TTFB covers more than the platform
Time to first byte includes redirects, the DNS lookup, the connection, the TLS handshake, network distance and the server’s work. The data shows which sites are fast. It doesn’t show why, and it doesn’t prove the platform causes the difference. Hosting, CDN use, the visitor’s location and site size all vary by platform. This is correlation only.
Samples differ in size
WooCommerce includes hundreds of thousands of small sites, and Shopify more than 430,000. SAP Commerce Cloud has 1,850 origins and Magento with Hyvä 4,593. Some cells in the top tiers are small, and their n is reported next to the figure. Cells under n = 20 are shown as counts.
Moderate originality
Each platform’s numbers can be looked up one technology at a time on HTTP Archive’s site. This study’s contribution is the 12-platform comparison, the popularity-tier control, the split between time to first byte and Core Web Vitals, the country cut and the three-year trend in one place. The annual re-run makes it a series.
Medians in buckets
Median time to first byte comes from 100 ms histogram buckets, so it’s reported as a range. A median of 1,200–1,299 ms means the middle site fell somewhere in that bucket. The data doesn’t give a single millisecond value.
What we will measure next
Three additions are planned. scandiweb will re-run this analysis every September, so the trend in Table 4 gains a column each year on the same instrument and the same definitions. The next edition will also split desktop and mobile by country, and it will add uncached page build times measured directly on a sample of stores.
The annual re-run is the main one. The 2023 to 2026 trend already shows that Magento’s server response moved mostly in the last year, and a yearly series will show whether that continues.
The desktop-by-country cut tests the distance explanation. If the country pattern in Table 5 comes from where stores are hosted, it should appear on desktop too, and the mobile and desktop columns should move together.
The uncached build measurement addresses the biggest limitation. Chrome’s field data can’t separate network time from server work, and measuring how long Magento takes to build a page with the cache empty, on a sample of real stores, is the only way to see how much of the gap the server itself accounts for.
Frequently asked questions
Which eCommerce platform is the fastest?
On server response in September 2026, Shopify. According to scandiweb’s analysis of Chrome UX Report data, 83.8% of Shopify sites gave mobile visitors a good time to first byte, followed by Webflow at 77.5%, Squarespace at 76.6% and Wix at 73.1%. All four run every store on the vendor’s own infrastructure. The ranking covers server response only, and Shopware leads on Core Web Vitals at 84.0%.
Is Magento slower than Shopify?
On server response, yes, for most stores. In September 2026, 23.0% of Magento sites had a good mobile time to first byte against 83.8% of Shopify sites, and the median Magento store responded in 1,200–1,299 ms against 500–599 ms. The gap holds among sites of similar popularity and in all three countries checked. The data doesn’t show whether the platform itself is the cause.
What is a good TTFB for an online store?
800 ms or less at the 75th percentile, which means the server starts responding within 0.8 seconds on at least three out of four visits. Google’s TTFB guidance calls that good and more than 1.8 seconds poor. In September 2026, 45.9% of all websites with Chrome data met the good threshold on mobile, and the median site fell in the 800–899 ms bucket.
Does Hyvä make Magento faster?
In the browser, yes. Magento sites running Hyvä passed all three Core Web Vitals on mobile 66.4% of the time in September 2026, against 44.6% for Magento overall, and their median Lighthouse score was 48 against 35. On the server, no. Their good time-to-first-byte share was 23.2%, almost the same as Magento’s 23.0%, because a theme changes what the browser does after the first byte arrives.
Is TTFB a Core Web Vital?
No. The three Core Web Vitals are Largest Contentful Paint, Interaction to Next Paint and Cumulative Layout Shift. Google’s TTFB guidance says that because TTFB isn’t one of them, a site doesn’t have to meet the good threshold to pass. The Chrome UX Report lists it as an experimental metric collected on full page loads only. A store can pass Core Web Vitals with a slow server, as Shopware’s numbers show.
Why are hosted platforms faster on server response?
The data doesn’t say. The four leaders on time to first byte all run every store on the vendor’s own infrastructure, so the merchant never picks a host, a cache or a server size, and that is an observation rather than a proven cause. Hosting, CDN use, the visitor’s location and the size of a typical store all vary by platform, and this study measures correlation only.
Cite this research
- Title: “The Fastest eCommerce Platform? Server Response Times for 12 Platforms”
- Author: scandiweb
- Published: November 3, 2026
- URL: https://scandiweb.com/blog/fastest-ecommerce-platform/
- Data: Chrome UX Report via HTTP Archive Tech Report, September 2026.
Press and analyst enquiries about the dataset or the method can go to our team.
Where the fastest eCommerce platform wins, and what Magento can do
The fastest eCommerce platform on server response in September 2026 was Shopify, with 83.8% of sites giving mobile visitors a good time to first byte, and Magento ranked 10th of 12 at 23.0%. The gap held among sites of similar popularity, in the United States, the United Kingdom and Germany, and across three years of data. Magento gained seven points since 2023 while Shopify gained almost six, so the distance between them stayed close to 60 points.
The Hyvä numbers carry the practical lesson. A frontend theme lifted the Core Web Vitals pass rate from 44.6% to 66.4% and left server response at 23.2%, almost the same as Magento overall. Browser work and server work are separate projects, and most Magento stores have done more of the first than the second.
Time to first byte is where a Magento store can still gain the most, and it is also the number most stores haven’t measured on their own.
To find out where your store falls on these charts, ask us to measure your server response before you commission anything else.