Over the last decade, successful eCommerce businesses have been perfecting their websites using lean process optimization as part of their company strategy. For many of them, A/B testing has proven to be a trusted go-to technique.
According to Invesp:
- 77% of companies perform A/B tests on their websites
- 71% of companies run two or more A/B tests per month
- 60% of companies believe A/B testing is highly valuable for conversion rate optimization
In order to maintain a competitive edge, most online stores and apps constantly find themselves looking for ways to improve their customer experience. At the end of the day, this is essential for enabling conversions and, ultimately, increasing sales.
In this post, we will dive into the benefits of website optimization using A/B testing, and go over the main steps necessary to set up an effective testing procedure.
What is A/B testing?
A/B testing is a scientific approach to comparing two or more page versions in order to identify the best-performing one.
Defining terms:
- Control (Variant A) is the current version of a webpage that you are looking to improve
- Variant (Variant B) is a version of the webpage, improved based on a previously defined test hypothesis
- Test hypothesis is an assumption that updating a page will result in performance improvement.
The variant includes any changes to the page you need to test – for example, changes in the copy or functionality alterations. In the best-case scenario, you should be able to attribute KPI increase or decrease to a specific change on the page. Therefore, it is recommended to test different versions of the same element against one another: one headline option vs the other, video vs image, two locations of one element on the page, etc.
When the A/B test is set up, your website shows two versions of the same page simultaneously. Site visitors randomly see either control or variant on their device and user interaction with both variants gets recorded. Later this data can be analyzed in order to identify which version performed better.
As soon as visitors open the page, they enter the experiment. Their browser cookies are registered in the system along with the information of which page version was shown to them. This ensures that during the experiment users always see the same page version as they saw the first time they visited the website.
Benefits of A/B testing
Businesses often find themselves asking the same question: “Why should I invest in A/B testing?” In fact, there are several benefits of introducing A/B testing to your optimization program. Some of the advantages it allows you to achieve are listed below.
Reduce risks
The introduction of radical changes to your website can sometimes cause more harm than good. A/B testing helps ensure that the changes causing drastic KPI decrease will not be implemented.
Gain knowledge
Each new A/B test brings additional data about your website visitors. This helps understand how users respond to certain page elements and makes it easier to come up with more robust and data-driven optimization hypotheses.
Exclude HiPPO effect
A common trend among businesses is to make decisions based on the highest-paid person’s opinion (HiPPO effect). Even though on many occasions this may be justified, human beings are vastly influenced by irrational factors such as biases, previous experience, and intuition. This, in turn, has the potential of affecting the ability to make the best choice on the spot. With A/B testing decisions are more likely to be made on science rather than gut feeling.
Motivate co-workers
Company employees may grow reluctant to generate and share ideas if they don’t see them implemented over time. A/B testing allows you to safely test even the craziest ideas, and let the data determine which ones will be applied. Thus, everyone feels involved and heard.
The process of A/B testing
Continual eCom business growth relies heavily on how well your processes are aligned. Testing multiple random ideas at once will hardly result in continuous improvement of your website and the growth of your business. At the same time, a clear and well-considered optimization workflow can and often does bring a significant KPI increase.
In the following sections, we will walk you through the most important steps of a successful A/B testing process. These comprise the following:
- Gathering & analyzing the data,
- Defining the hypothesis,
- Prioritizing hypotheses,
- Creating variant,
- Running the A/B test,
- Measuring the results,
- Implementing changes.
Step #7 is taken based on the results of each A/B test you perform. This means that the changes are only implemented if they are approved and proven to be effective.
1: Data Gathering & Analysis
Before proceeding with any optimization measures, you need to make sure that you have the data to guide your efforts. This includes understanding who your users are, how they interact with the website, and what are the main optimization opportunities (i.e., where you’re losing money).
This can be achieved through quantitative and qualitative data gathering and analysis.
Quantitative data allows you to identify various bottlenecks across your website. To get your hands on this information you need to first set up a digital analytics tool, such as Google Analytics, Adobe Analytics, Yandex Metrica, or any other tool that fits your needs. Next, you need to analyze the data collected in your current digital analytics tool.
In general, to achieve accurate results, we recommend performing analysis on the following data set:
- Page reports – What are the most popular pages on the website?
- Demographic reports – Who are your users?
- Technology reports – What technologies are they using? What devices should you account for?
- Top events – If you have custom events configured, analyzing them can give you a great insight into how prospects use your website.
After completing the quantitative analysis and identifying the main areas of improvement, it is time to proceed with the qualitative data research.
Qualitative data helps you see what kind of problems visitors face on the website. This research will depend on resource availability. Some of the most efficient ways to gather this data are as follows:
- Watching session recordings
- Heatmap analysis
- Conducting user surveys
- Conducting user tests
- Conducting interviews with customer care center workers
- Performing heuristic analysis.
2: Defining the hypothesis
The data that you have gathered and analyzed in the previous step should give you an idea of what is stopping your website visitors from making or closing the purchase. These assumptions should be turned into hypotheses that describe possible solutions. Hypotheses are commonly defined using the following formula: “By implementing change A, we expect metric X to increase/decrease”.
The hypotheses you have come up with will be A/B tested at a later stage. Given that you have multiple hypotheses it is important to decide which ones are more likely to bring higher ROI. These should be prioritized and tested during the first iteration.
3: Prioritizing hypotheses
Let’s assume you have come up with 10 hypotheses for your website optimization. In order to prioritize them and decide which ones to test first, you need to rank them 1 to 10.
Note: You need to verify that your hypothesis is valid for A/B testing, i.e. it can generate 300 – 400 conversions per variant, per segment that interests you during the experiment. If this threshold isn’t met, running the test might be ineffective, as there is a high chance of getting false-positive results.
While there are multiple prioritization methods online, below we will focus on one particular approach that has proven to work reliably – including, for our team.
The approach consists of 2 steps:
- Funnel-based prioritization
- Evidence-based prioritization.
Funnel-based prioritization
First, you need to determine which of the shopping funnel steps each hypothesis is related to.
eCommerce websites usually comprise the following 5 steps:
- Landing page (most likely Homepage)
- Category page
- Product details page
- Shopping cart
- Checkout.
Hypotheses that are the closest to the end of the funnel are of the highest priority.
Evidence-based prioritization
One shopping funnel step can have several related hypotheses. Thus, additional prioritization may be necessary to rank hypotheses within the same funnel step. This is where the so-called evidence-based prioritization comes in handy.
Evidence-based prioritization is inspired by PXL methodology, and the idea is to determine and prioritize the hypotheses that have the most data to back them up. By contrast, hypotheses that are based mainly on intuition should be tested last.
Evidence-based prioritization consists of 7 questions:
- Is the hypothesis confirmed by quantitative data analysis?
- Is it confirmed by heuristic analysis?
- Is it confirmed by user tests?
- Is it confirmed by user surveys/polls/feedback?
- Is it confirmed by session recordings?
- Is it confirmed by heatmap analysis?
- How many hours does it take to develop the test?
The first 6 are Y/N questions, and the hypothesis receives 1 point for every ‘Yes’ and 0 points for every ‘No’. The 7th question is answered by calculating hours: up to 4h – 3 points, up to 8h – 2 points, up to 16h – 1 point, more than 16h – 0 points. The hypothesis that receives the highest score should be tested first.
4: Creating variant
Now that you’ve ranked and prioritized your hypotheses, you are ready to start preparations for the test.
Create variant
As you are developing the variant, make sure the design changes are communicated clearly enough. All parties involved – stakeholders, developers, etc. – should be on the same page as to what the new design looks like.
Implement the test
When the design is ready and approved you can proceed with implementing the test. In most cases, it can be executed using ready-to-use A/B testing solutions. Overall, the implementation of the test will depend, among other things, on its difficulty, the resources available, the tools you are using to run the test.
The most popular tool according to BuiltWith stats is Google Optimize. Developed as Google’s own tool for website experimentation, Google Optimize offers two versions: free Google Optimize Basic, and paid Google Optimize 360.
The main differences between Google Optimize Basic and Optimize 360, apart from the price, are as follows:
- the number of preconfigured objections to tracking during the test – 3 in Optimize Basic, and 10 in Optimize 360
- the number of experiments you can run simultaneously – 5 in Optimize Basic, and more than 100 in Optimize 360.
On top of the basic A/B testing, both versions offer 2 more experiment types:
- Redirect testing – a form of A/B testing, where separate pages are tested against one another with the variant being defined by URL or path. This type of experiment can be helpful when testing a complete page redesign instead of changing only several of its elements.
- Multivariate testing (MVT) is another form of A/B test, where two or more elements are tested simultaneously to see which element combination will perform best. Thus, instead of finding out which page variant performs best, you are able to find the most beneficial combination of several page elements.
In general, it is fair to say that Google Optimize Basic covers the needs of most small to medium-sized businesses, while enterprise-level businesses will find Google Optimize 360 more suitable for their needs and budget.
5: Running the A/B test
At this point, you should have identified both the type of test you are planning to run, as well as the testing tool you are going to use. The only two things left to do before you launch the test are calculating test duration and sample size.
A/B test duration is the timeframe recommended for running the test in order to collect the data about each version’s performance. The requirements it has to meet are as follows:
- It has to be no less than one business cycle long (for most eCommerce stores it is one week)
- It has to last long enough to collect the necessary sample size.
A/B test sample size is the number of participants required to make valid decisions about the results of the experiment.
Calculating both of these indexes is fairly straightforward and can be done using any of the free A/B test calculators. One of the better options is CXL’s sample size calculator, but there are multiple others available online.
Calculating this will let you know exactly when you have enough data to end the test and start analyzing the results. Now, feel free to launch the test and wait for the results.
6: Measuring the results
After the test has run for at least two business cycles and reached the required sample size, it is time to close the test and evaluate the results.
Most A/B testing tools have built-in reporting capabilities. However, these standard reports often lack the capacity for in-depth and segmented analysis. This makes it difficult to evaluate test results correctly and make the right conclusions.
An important side note is that the A/B test result evaluation is rooted in statistical analysis. While there are multiple tools that allow automating parts of the calculation, having an understanding of at least the basics of statistics definitely helps. Let’s take a look at some of these core concepts.
Statistical significance
This is the statistical proof that A/B test results are valid and not based on a random chance. Statistical significance reflects how confident you want to be in your test results. In A/B testing it is common to set a significance level to 95%, which allows only a 5% chance of error.
Statistical significance depends on two factors:
Sample size
As covered before, this is the number of users who participated in the experiment. The bigger the sample size is, the more confident you can be about the results being correct.
Calculating statistical significance is a two-fold process. On the surface level, there are multiple ready-to-use online calculators that will evaluate test results and calculate whether statistical significance has been reached. Nevertheless, it takes additional expertise to see correlations draw conclusions from numerical data. As a rule, in the Web/eCom context, this is a responsibility of a dedicated CRO team.
Minimum detectable effect
This is the minimum difference between each variant’s performance within the observed experiment. The greater difference means that you can be more confident about your observations. Additionally, it requires a smaller sample size to estimate the results.
Result visualization
This is the step where you should have completed your test, evaluated the data, discovered the results of the experiment, and drawn conclusions. But before you can proceed with the implementation, you need to make sure that the changes are validated and accepted by various parties, such as shareholders, developers, and other teams involved in the process. This means that the results of the experiment have to be clearly communicated. This is done best with the help of data visualization tools.
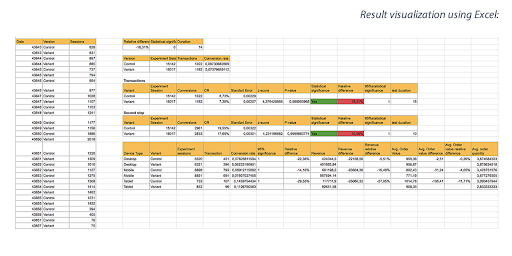
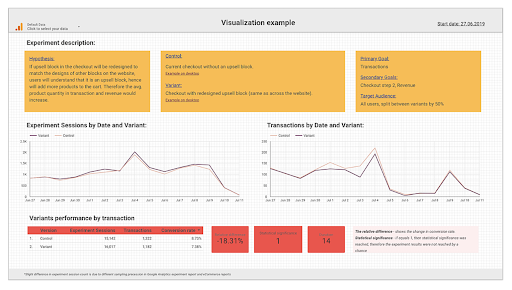
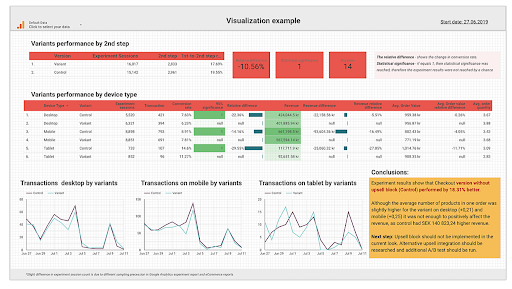
Consider the two report examples below:
While table data representation is commonly used and looks credible, it lacks readability, making it difficult to make sense of on the fly.

The second example presents the same information but does so in a much more comprehensible manner. Another benefit of such a report is that it can serve the purpose of test documentation over time. This makes it easy for all parties involved to go back to it and see what and when was tested and what outcomes were achieved.


This particular example was created using Google Data Studio – Google’s own tool for data visualization. For those of you who are interested, we have prepared a detailed guide on how to create live-mode dashboards for A/B test results.
After the test is evaluated and decisions are made, it is time to go back to the first step of the iterative A/B testing process, i.e., analyze new data, review the hypothesis and kick off a new test.
7: Implementing the variant
How can you tell whether the changes tested in the variant are ready to be implemented permanently?
The answer lies on the surface: you are good to proceed if the test results clearly suggest that the variant has outperformed the control, and an agreement has been reached to implement the changes.
However, keep in mind that the experiment doesn’t end here. You still have to make sure you monitor the objectives set during the experiment, even after the changes are permanently implemented. This will help ensure that the improvements are real and sustainable, rather than influenced by external factors during the experiment, such as seasonal demand changes.
Looking to elevate your website’s conversions through A/B testing? Let us help you! Browse around for more information about our conversion optimization services, and feel free to get in touch at [email protected]!


Share on: