The tech world is full of dark corners and dangers, so you must always be vary! You’ve probably heard of the popular term “DDoS” or “Distributed Denial-Of-Service” attacks. They have become almost routine and can be real pain if yout don’t know how to properly deal with them. Luckily for you our team of DDoS detectives are here to lead you by example. We’ll show you how to stop DDoS attacks with real life examples and what our process looks like.
In this article, we share two separate cases of how Scandiweb resolved malicious service denial attacks targeted at our clients.
How to Stop DDoS Attacks – Black Friday Edition
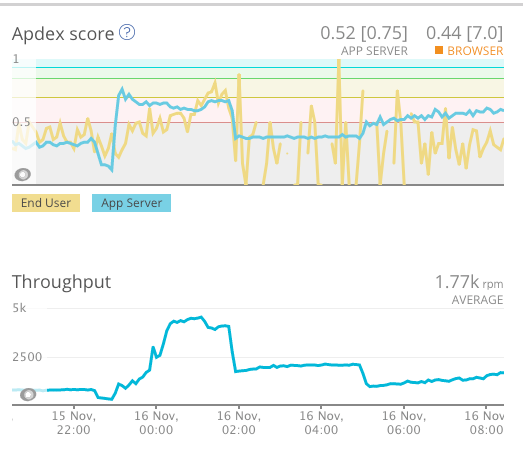
It came to our attention that our client site’s response time was gradually increasing to the point that there was a risk that it would stop responding entirely in 4–6 hours. GA showed visitors and conversions to be as usual. Given the proximity of Black Friday, this was an especially urgent issue to resolve and find a fix for.
So we investigated.
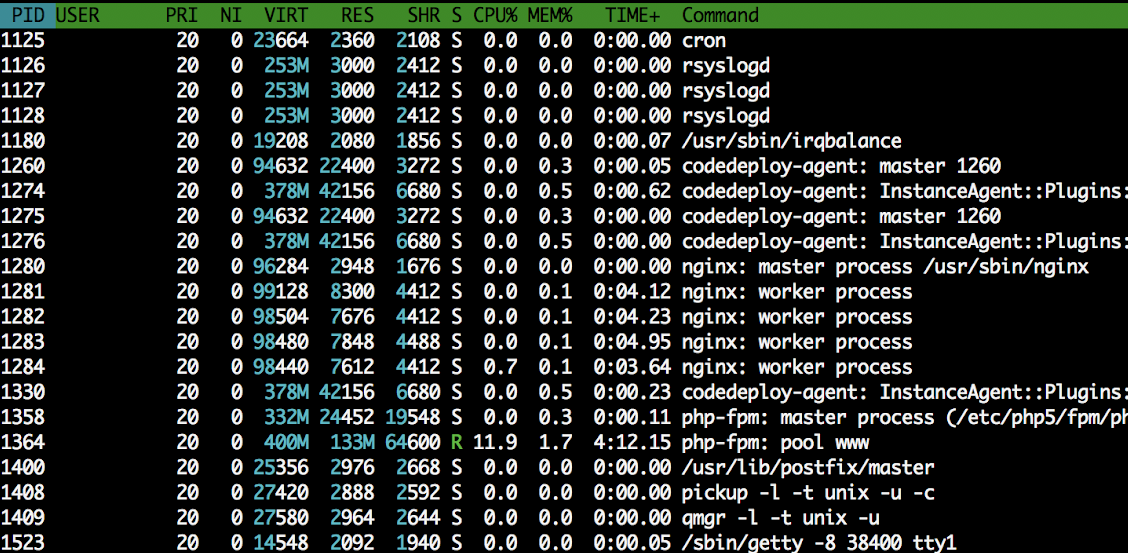
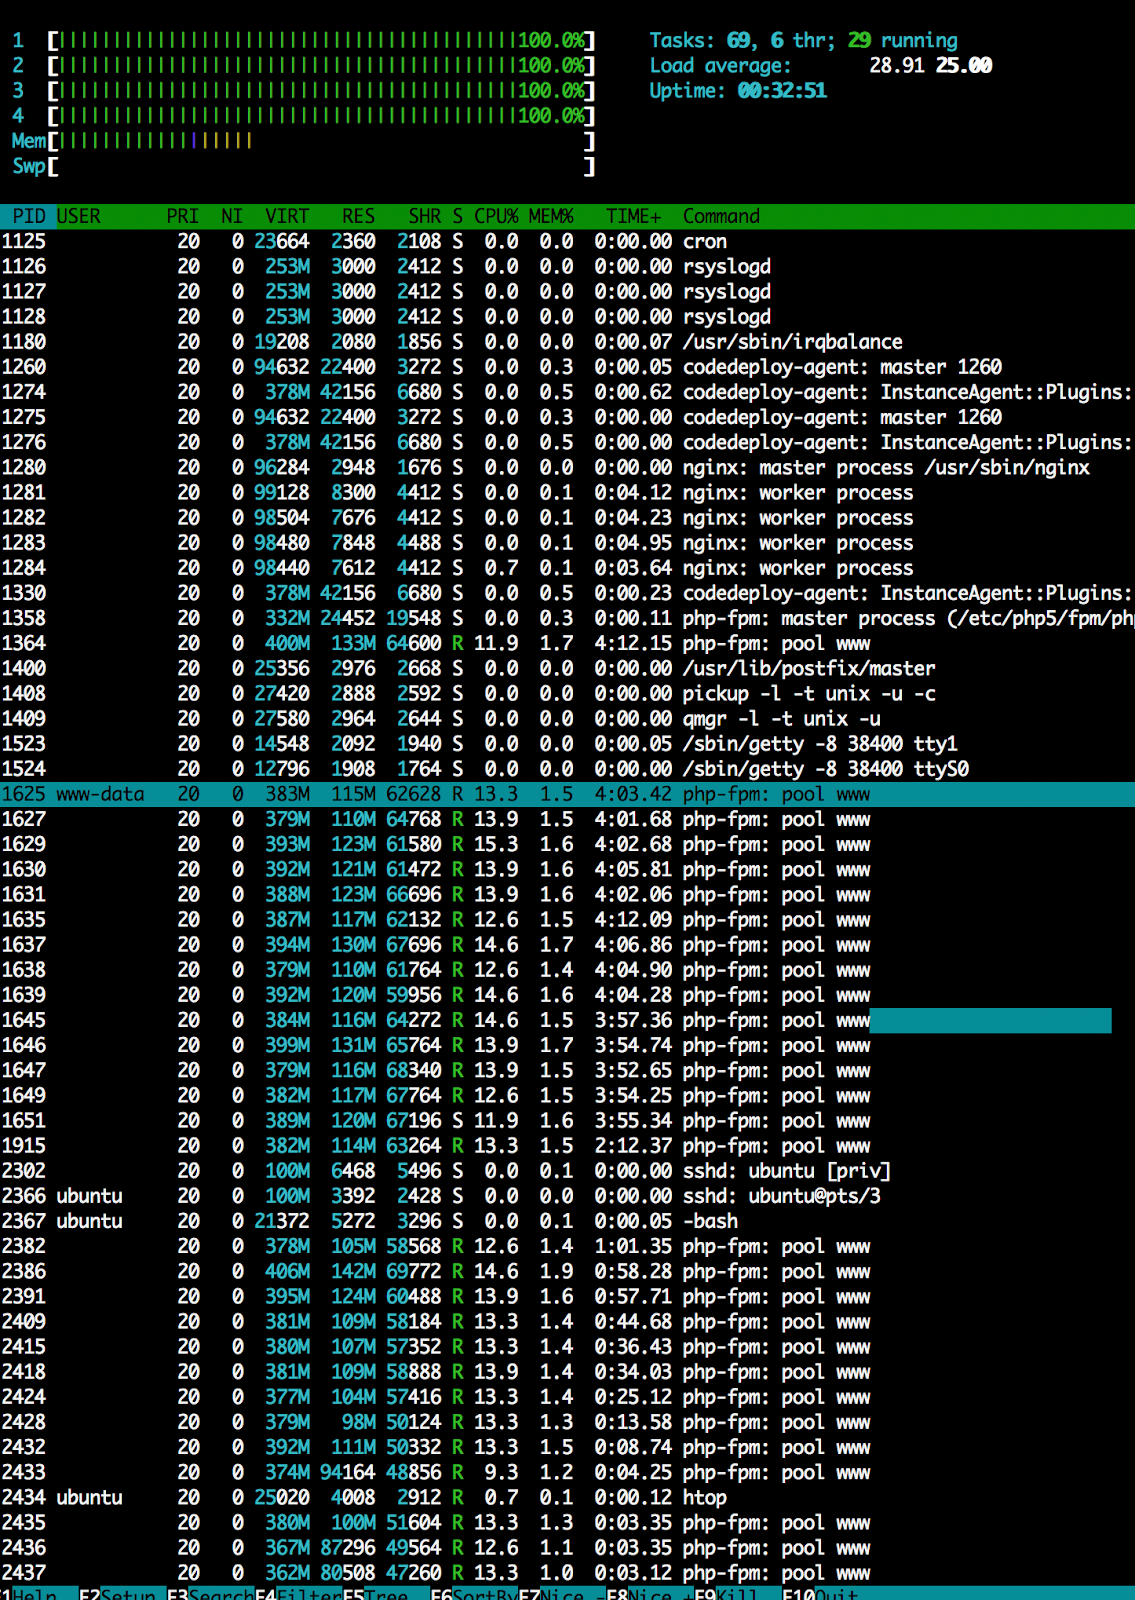
After checking the status of frontend instances, it was noticed that all instances except for one are at around 20% CPU utilization.
The one that was the exception was at 100% CPU utilization.
We tried detaching that faulty instance from the load balancer and adding a new one in place, however, the newly added instance had the same problem — 100% CPU utilization, while all others remain at around 20%.
We also noticed that the faulty instance had PHP processes piling up:
Faced with these issues, we had some idea of where to look and were soon able to determine that
there was a malicious attack coming from a specific IP, whom we quickly identified since their data was listed on the ISP’s records.
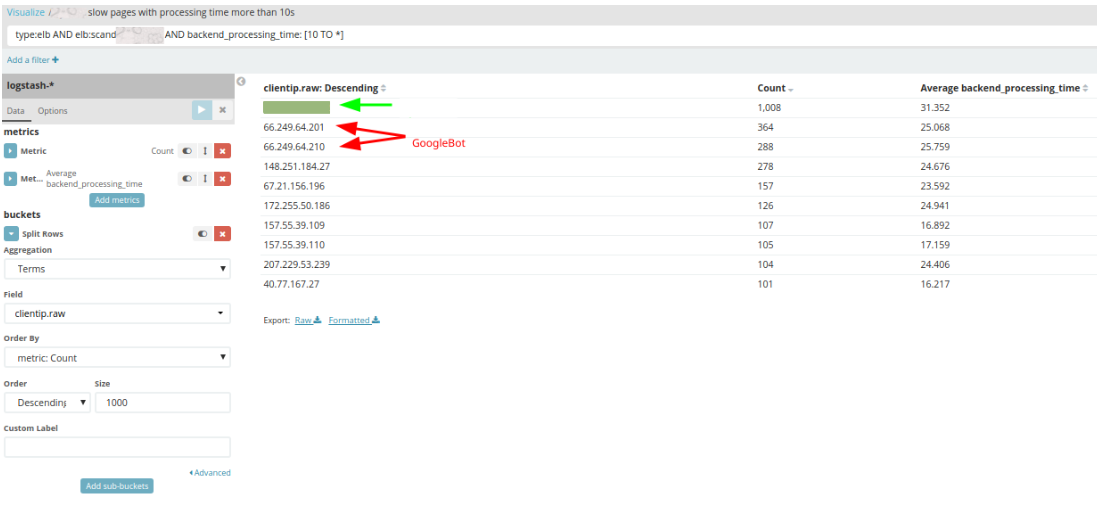
We could see 500 requests executed by that address, which suggested that this was a malicious user. The attack started at around 14:00 UTC and lasted until ~21:00 UTC.
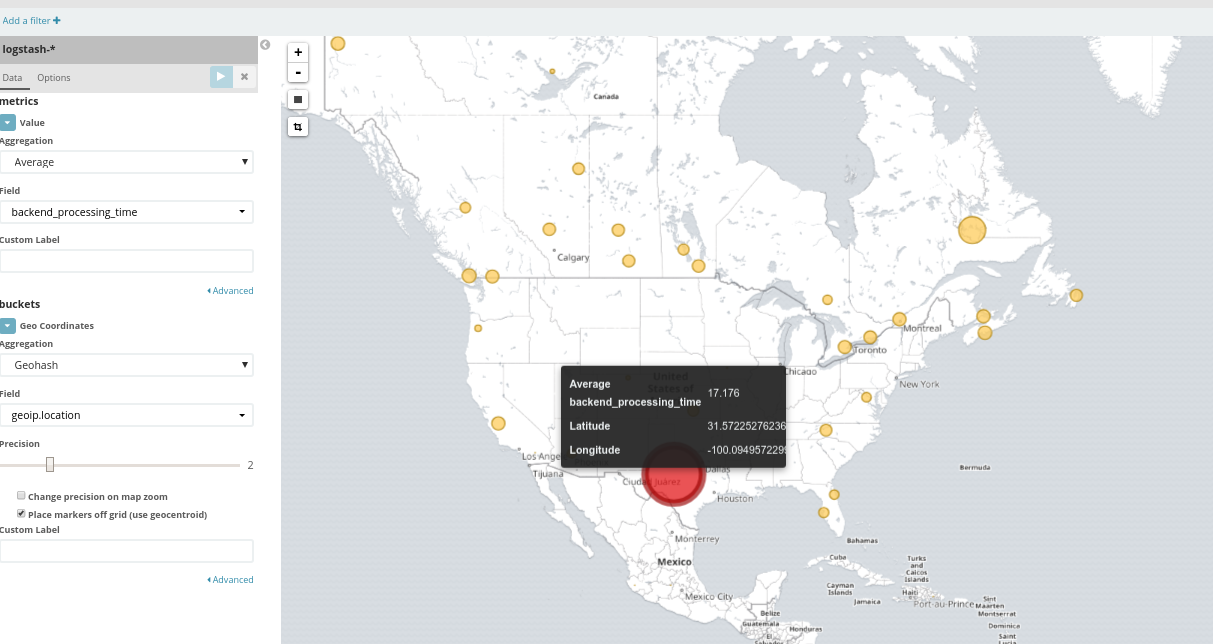
To ensure our hypothesis of it being a malicious user was absolutely correct, we looked into abnormalities in backend response times which were shown by our access log monitoring tool Logstash.
The above query pointed out that there is definitely some abnormality and led me to search which IP addresses made slowest requests.
While there was no exact known cause why some of the instances were rendered unstable by the payloads executed by the aforementioned IP address, we did the following to mitigate the issue:
- Blocked all IP addresses operated by the agency linked with the IP address by adding them to AWS VPC network ACL
- Replaced all except one affected instance
- Left one instance which was online during the attack powered of which can be used for further investigation of what exactly caused this issue
Additionally, whilst looking into the network operator’s LinkedIn it was noticed that he is an active Tor Exit node host and indeed — some of the IP addresses used by aforementioned ISP are used as Tor exit nodes. It is possible that the actions executed by the IP address were not done by the network owner, but by someone using Tor to mask his identity.
We confirmed that our client had no connection with the agency behind the malicious traffic and proposed the following to lower the impact of such cases in the future:
- Improve AWS load balancer health checks to check the status of Magento instead of just Nginx accessibility
- Adjust AWS health checks to automatically replace instances failing health checks instead of just marking them as unhealthy and not sending any requests
The client took this into consideration and there have been no more problems with this.
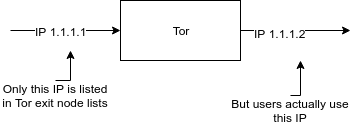
Further investigation revealed that the IP address was not in Tor Exit node lists, but there was a high possibility it is (other IP addresses in same IP range were). It is very likely that the way the nodes were operated is as in the graph below:
So even though if there was a Tor exit node blacklist it would not have helped.
In case #2 that we’re getting to shortly, it was not Tor, but a bunch of servers around Europe. Some of the servers were VPN endpoints and the client was adamant on not blocking them outright, because, well, the country of origin of many visitors had a censorship issue. We needed to make sure that those are not legitimate users first.
How to Stop DDoS Attacks: Attack from Europe
For our second case, it started off similarly — the client’s server was continuously loaded, which affected the user experience of the page’s visitors.
The client initially was hostile, thinking it was the result of some of our work, we recently implemented. Scandiweb approached this very openminded at first, despite sensing some foul play here and came up with the following hypotheses:
- It might have happened due to increase in traffic — for 2 weeks there were maximum 800 requests per minute, but now 2800 = 3.5 times more –
- There are a lot of varnish processes in htop, but the average load is stable (53 52 52)
- Log statistics
- All those requests are coming from
Mozilla/5.0 (Windows NT 6.1) AppleWebKit/537.36 (KHTML, like Gecko) Chrome/41.0.2228.0 Safari/537.36awsfrontlb = front-ends
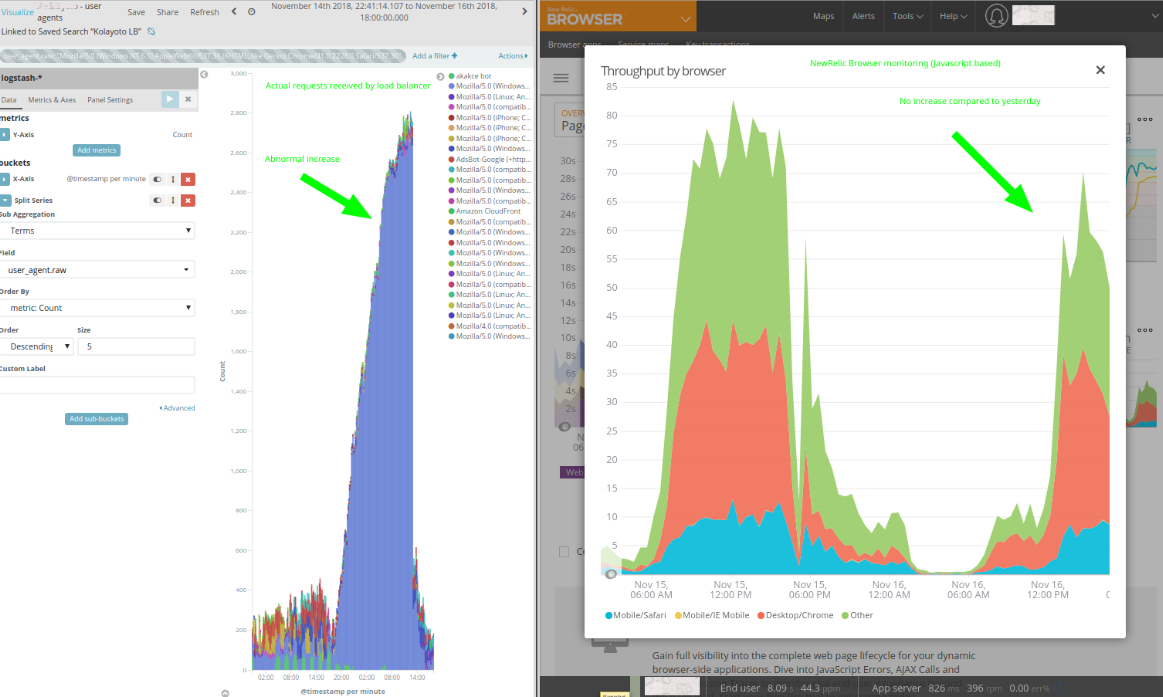
What we saw was that there was an unusually big increase in the external requests to the server. We identified that a big portion of it is with user agent from Chrome 41 (few years old Chrome version). This was suspicious and made us think that these requests might be with malicious intent (to perhaps bring down the server).
To make sure they were indeed malicious and, if so, to block them, we investigated further.
The spike was caused by bots disguised as Chrome 41 which started ramping up its requests from 15 Nov 17:00 until 16 Nov 12:30 and there was no perceivable connection between the spike and Scandiweb’s applied quick-fix, which initially the client thought to be the issue.
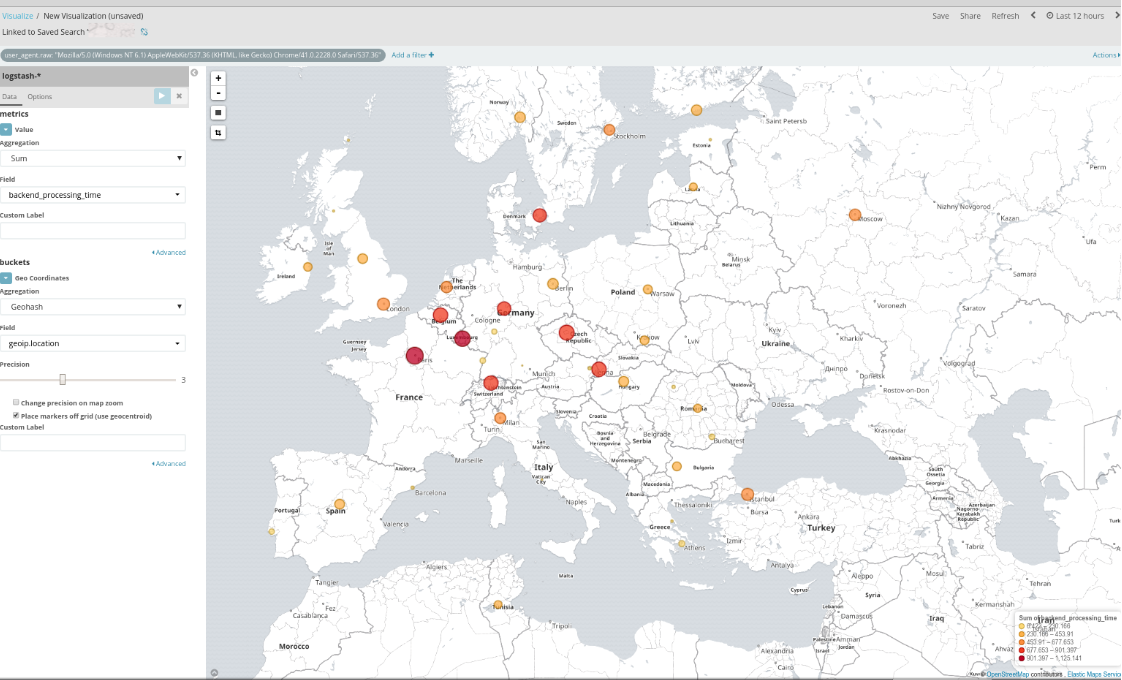
Additionally whilst looking more into the requests it can be clearly seen that these requests — coming from Chrome 41 user agent — are coming from all across Europe.
Moreover, the fact that the request increase is not shown in NewRelic Browser metrics and Google Analytics indicated that these users are not rendering Javascript, thus are not legitimate users, but crawlers.
Some of the IP addresses used by crawlers are VPN endpoints (e.g TorGuard) and proxies, however, there is no clear distinction between used ISPs or countries.
We offered 2 solutions to this issue:
- Temporary — Block the user agent used by bots — “Mozilla/5.0 (Windows NT 6.1) AppleWebKit/537.36 (KHTML, like Gecko) Chrome/41.0.2228.0 Safari/537.36” by updating Nginx configuration — this will only work until they adapt and change the user agent.
- Permanent — Migrate DNS to Cloudflare and add Cloudflare — this will allow to easily switch the site’s “Security level” to block abusive bots. If any legitimate users are marked as bots they would be presented with a Captcha screen, which, successfully completed, would let them into the site.
Unfortunately, with NewRelic APM monitoring there aren’t easy options to filter out user agent and easily analyse them and, since Google Analytics and NewRelic Browser monitoring utilizes Javascript to receive monitoring data, they do not have reliable information which could point out bots.
There is an option to analyse logs on instances using GoAccess. It does not require much setup and can be easily installed without much nuisance.
Setting up a dedicated ELK (Elasticsearch, Kibana, Logstash) instance inside your AWS account, which would allow to easily analyze requests going through load balancers in the environment, is another good permanent option.
Has your store suffered from malicious attacks? Do you have some interesting experiences to share? Or perhaps you’re interested in Scandiweb’s services? Drop us a line at [email protected] and let’s talk or check out our service page!




Share on: