When our CRO team starts to work with a new project, the first website area revised is checkout. When performing monthly audits for existing clients, the area we keep a close eye on is also checkout.
Why so much attention to checkout?
Checkout is the step in the user journey where visitors are the most motivated to make a purchase. Therefore any mistake here can drastically affect the website’s success rate.
With a one-time checkout data analysis, we can identify specific areas to improve. For example, the first step might not need fields that only make the form longer, or the delivery terms are not self-explanatory. At the same time, a regular analysis can help to follow how the checkout is maintained in all segments.
Google Analytics is a great helper to analyze checkout behavior. There are two ways to use it.
The first one, more advanced, is the analysis by Checkout behavior funnel and Enhanced eCommerce set-up. Despite the amazing data points, you will need a developer to work on implementing tracking, and they are not always accessible.
Another way that does not involve developers is to build a page path based checkout funnel.
In the next paragraphs, you can read our story on how we built a checkout tracking report in Google Data Studio by using standard and calculated metrics.
For additional insights, check out our Data Studio webinar, where we show the report planning process, how to build insightful reports, and explain what defines a report as easy to read.
Investigate the starting point
The first step of building a checkout tracking report is to define what questions the report should answer. Secondly, understand why you are building the checkout performance measurement in Google Data Studio instead of Google Analytics.
In our case, the client experienced a significant drop in conversion rate, so we wanted to start by reviewing the detailed checkout experience. However, the client didn’t have nor EEC set-up, nor a goal in GA. We knew how quickly we could create a Data Studio report with not only the main metrics but also detailed segmentation, so we decided to proceed with this method.

Regarding segmentation, the checkout didn’t have any recent content-related changes. If something was wrong, it was most likely related to functionalities.
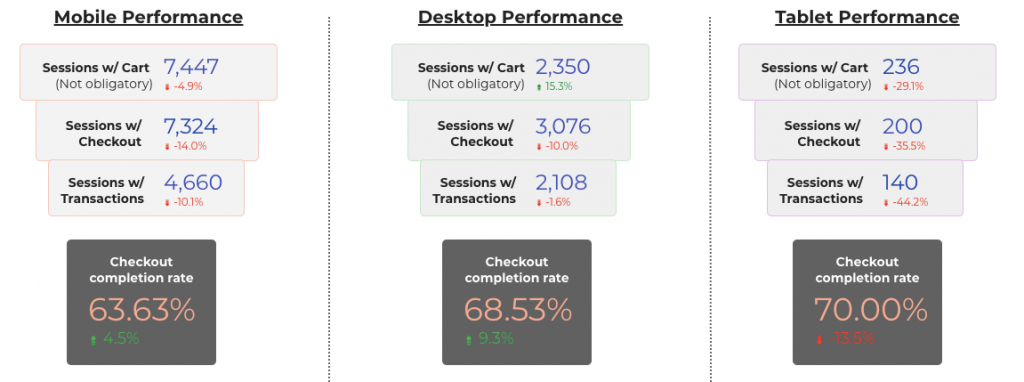
Also, the mobile checkout funnel was different. Users didn’t need to visit the cart obligatory, so the general funnel data wasn’t precise, and we needed to add additional device type segments.
Building the report
After collecting ideas for the expected outcome, we started building the report. We added the checkout funnel, the conversion rate as a scorecard, and as a timeline chart at the top of the dashboard. This block shows general data of user behavior in checkout.
By the way, you can’t create a calculated field after applying a segment in Google Data Studio. However, DS allows us to blend the data. To calculate the checkout conversion rate, we created two scorecards with unique page views. We applied a filter that includes page path “one-step checkout” to one of them and a “success” filter to the other. Then we blended the data and created a calculated metric.
The second block had the same data but split by device type. We added two conversion rate timeline charts: 1) full-funnel, including cart; 2) only checkout and transactions. By this information, we can see if there are specific changes in any of the devices and how the cart affects mobile performance.
Finally, we added a timeline chart with the overall website’s eCommerce conversion rate. Although the report is about checkout, the page views and rates are strongly affected by other purchase steps.
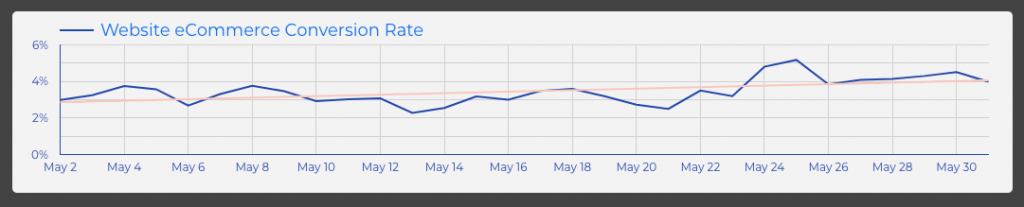
E.g., after a quick research, we discovered that the main reason for decreased conversion rates was a non-mobile-friendly add to cart pop-up that made it very difficult to visit the checkout.
Wrapping up
This was our story on how to create a checkout tracking report. The good news is, the same method can be applied to track any other funnel the website has. E.g., a full shopping behavior funnel if there are specific parameters that describe the page type.
Build more reports, find more insights, and make your conversion rates sky-rocket! And if you run into some trouble, don’t hesitate to reach out!

Share on: