Most of the A/B tests that get run on eCommerce sites are statistically meaningless. They end early because a 12% lift on day three felt too good to ignore. They split traffic across a dozen pairwise comparisons and call the noisiest one a winner. They run for three days of paid-search traffic and miss the weekend buying cohort entirely. None of that is malpractice, it is the default state of an experimentation program that grew faster than its statistical discipline. The 7-step framework below is the one we run across more than 1,000 production A/B tests, built to stop those failure modes before they reach the postmortem.
One reference point on tooling, since the question comes up first: Google Optimize was sunset on September 30, 2023, and the modern stack is now VWO, Optimizely Web Experimentation, Adobe Target, AB Tasty, Convert.com, and the open-source GrowthBook. If your playbook still names Optimize Basic or Optimize 360, the rest of this guide will show you what to swap in.
Overview
- Website a/b testing is a controlled experiment that splits live traffic between two or more page variants to identify which one moves a target metric, measured with statistical significance.
- A defensible eCommerce program runs on seven sequential steps: gather data, write a hypothesis, prioritize, build the variant, run the test at the right sample size, measure with the right statistical tools, and ship the winner with a guardrail period.
- Across our agency program of more than 1,000 A/B tests, winning variants routinely add seven-figure annualized revenue, one 2025 test alone surfaced an extra $4.2 million for a single client.
🚀 Quick takeaway
The framework is sequential for a reason. Skip Step 3 (prioritization) and you waste cycles on low-priority tests, skip Step 5 (sample size) and you declare false positives, skip Step 7 (post-launch guardrail) and you miss reversions you never measure.
What is website A/B testing?
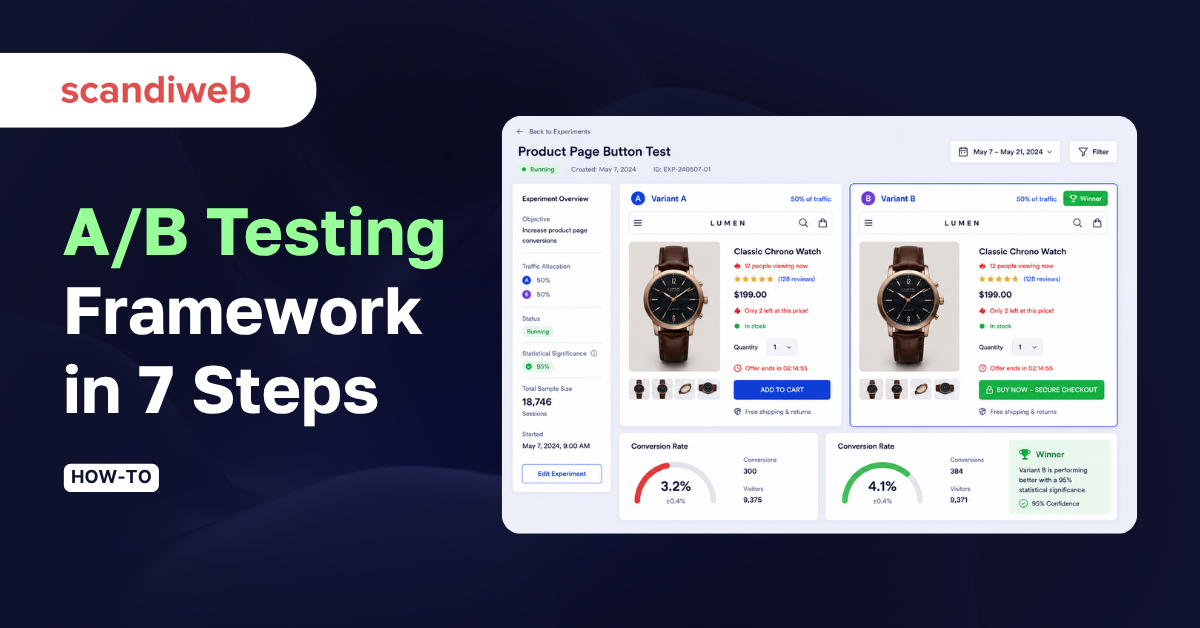
Website a/b testing is a quantitative research method that splits live traffic between two or more versions of a webpage, then measures which version performs better on a defined metric, typically conversion rate, revenue per visitor, or click-through to a key step in the funnel. The control (Variant A) is the current page. The variant (Variant B, C, and so on) is a single, isolated change tested against a clear hypothesis.
The discipline of a/b testing is that every visitor sees exactly one version, the assignment is random, and the result is read with a statistical test rather than a gut feeling. Per Nielsen Norman Group’s definition, the method only works when the two variants are tested with a live audience under the same conditions, the same time window, and a sample large enough to separate signal from noise.
Two related methods that are often confused with a/b testing:
- Multivariate testing (MVT) changes several elements at once and measures every combination. It needs far more traffic than a/b testing and answers a different question, namely which combination of changes wins.
- Split-URL testing sends each variant to a different URL, useful when the change is a full redesign rather than a single element. SEO rules below still apply.
🚀 Quick takeaway
A/B testing earns its keep only when the two versions are isolated by one change and the result is read with a statistical test, not a 12% day-three lift.
Why run A/B testing on eCommerce sites?
A permanent A/B testing program earns its keep on three compounding benefits: it caps the down-side of every launch on a slice of traffic instead of the full audience, it builds a labeled-outcome backlog the team can defend with leadership, and it shifts the deciding vote from the highest paid person to the data. Each benefit compounds the others over a year of running tests.
Reduce risk on every launch
Radical changes to a checkout, a PDP, or a navigation can move conversion in either direction, and the down-side is rarely symmetric. Testing the variant on a slice of traffic limits the down-side to that slice. Across our conversion rate optimization program the average winning variant adds 48% to the tested metric, the same program also catches losers before they roll out to the full audience.
Build a defensible knowledge base
Each test produces a labeled outcome that lives outside any one person’s head. Six months in, the backlog is no longer “ideas we had”, it is “ideas, scored by funnel position, with evidence behind each one”. That changes the conversation with leadership: instead of selling a feature, you cite the prior tests that suggest the next one is worth running.
Replace the HiPPO with data
Most decisions on a digital team get made by the highest paid person in the room. Human judgment carries biases, anchoring, and recency that show up as expensive variants nobody asked the user to vote on. A testing program does not eliminate that, it ranks it: the HiPPO can still propose the test, the data decides if it rolls out.
🚀 Quick takeaway
The program-level value of a/b testing is not the winners, it is the disciplined backlog of labeled outcomes you build over a year.
Step 1: Data gathering and analysis
Step one is to assemble the quantitative and qualitative picture of how users actually move through the site, so the hypotheses in Step 2 are evidence-based rather than opinion-based. A program that skips this step generates an unprioritized list of UI tweaks that score badly on every framework.
Quantitative data comes from your digital analytics stack. In 2026 that is GA4, Adobe Analytics, Mixpanel, Heap, or Amplitude, picked for fit with your data warehouse rather than for brand familiarity. The reports that matter for an experimentation program:
- Page reports – which pages carry the most revenue and the most traffic, ranked separately.
- Funnel reports – step-by-step drop-off through the conversion path, segmented by device and acquisition channel.
- Top events – custom events that mark the friction points (add-to-cart fails, search-with-no-result, form-field abandons).
- Audience reports – the device, geography, and source mix that the test will need to hold constant.
Qualitative data explains the why behind the numbers. A useful parallel technique is heuristic UX evaluation, which surfaces friction your analytics tools cannot see. Methods we use across client programs:
- Session recordings on the highest-drop-off pages
- Heatmaps on the templates that drive revenue
- On-site surveys at exit and after key actions
- Moderated user tests against the prioritized hypotheses
- Interviews with customer-service agents, who hear the issues before they show up in analytics
The output of Step 1 is a short list of friction points, each one with a number (how often it happens) and a story (what users are trying to do).
🚀 Quick takeaway
Step 1 is finished when every friction point on the list has both a quantitative size and a qualitative explanation. If one is missing, the hypothesis in Step 2 will be guesswork.
Step 2: Defining the hypothesis
A hypothesis is a falsifiable claim with one isolated change, one expected metric movement, and one reason the change should work. The formula we use:
If we change [element X] from [current state] to [new state], [primary metric] will [increase/decrease] by [expected delta], because [user-evidence reason from Step 1].
A worked example for an eCommerce checkout: “If we change the checkout CTA from ‘Continue’ to ‘Continue to payment’, add-to-cart-to-checkout-completion will increase by ~3%, because session recordings show 14% of users hesitate at the step transition.” Adobe’s framing is the same point in different words: a hypothesis is the contract that lets the team run the test in a controlled environment and learn what works before scaling. A hypothesis without an isolated change is a redesign, not a test. A hypothesis without a user-evidence reason is a guess. Both fail Step 3.
Step 3: Prioritizing hypotheses
With 10 to 15 hypotheses on the backlog, the question is which one to run first. The two-axis method that holds up across client programs:
Funnel-based prioritization. Map each hypothesis to a funnel step:
- Landing page (often the homepage)
- Category page
- Product detail page
- Cart
- Checkout
Funnel proximity matters because a 2% lift at checkout converts to more revenue than a 10% lift at the top of the funnel. As a default rule, hypotheses closer to checkout rank higher, but the rule is not absolute, a homepage test that affects 100% of sessions can still beat a checkout test that affects 4%. Use it as a starting point, not a verdict. For B2B-specific funnel weighting, see our guide to A/B testing for B2B sites, where lower volumes change the prioritization math entirely.
Evidence-based prioritization. Within a funnel step, rank hypotheses by how much Step 1 evidence sits behind them. Adapted from the PXL methodology, score each hypothesis against seven questions:
- Confirmed by quantitative data? (yes = 1, no = 0)
- Confirmed by heuristic analysis? (yes = 1, no = 0)
- Confirmed by user tests? (yes = 1, no = 0)
- Confirmed by user surveys or feedback? (yes = 1, no = 0)
- Confirmed by session recordings? (yes = 1, no = 0)
- Confirmed by heatmap analysis? (yes = 1, no = 0)
- Build effort: under 4h (3 points), under 8h (2), under 16h (1), more than 16h (0)
Highest score runs first. Lowest score gets parked until more evidence accumulates.
🚀 Quick takeaway
Prioritization is the step that turns a backlog into a roadmap. The hypothesis with the most evidence is also the hypothesis the team can defend if leadership asks why it ran ahead of someone’s pet idea.
Step 4: Building the variant
Step four turns the prioritized hypothesis into a working variant and an instrumented test. Two parts: the design and the implementation.
Design the variant. The variant lives in the same code path as the control, with a single isolated change. Communicate the change to engineering, analytics, and stakeholders before any code is written, the change ticket should name the element, the new state, the primary metric, and the success threshold. Variants that drift during build (an extra copy tweak, a different padding, a font change “while we’re in there”) are the most common cause of an unreadable result. Our UX Design team treats this as the contract, the build matches the spec or the test does not go live.
Implement the test. Pick a tool that fits the stack and the test cadence, and skip the rest. The 2026 tool table:
| Tool | Best fit | Pricing model (2026) | Notable strength |
|---|---|---|---|
| Optimizely Web Experimentation | Enterprise programs with multiple stakeholders | Custom, quote-based | Mature stats engine, deep audience targeting |
| VWO | Mid-market and enterprise eCommerce | Tiered, starts low four figures/month | Built-in heatmaps and session recordings in one platform |
| Adobe Target | Teams already on Adobe Experience Cloud | Bundled with Adobe Experience Cloud | Native integration with Adobe Analytics audiences |
| AB Tasty | EU-based programs needing GDPR-first defaults | Tiered, mid four figures/month | Strong personalization layer alongside testing |
| Convert.com | Privacy-strict programs | Mid three to four figures/month | No-cookie testing mode, lean implementation |
| GrowthBook | Engineering-led teams comfortable with feature flags | Open-source core, paid cloud tier | Server-side and feature-flag-driven experimentation |
A real example of a complex variant build sits in our Nuclear Blast A/B test case study, where the variant required server-side rendering and the implementation choice drove the rest of the project plan.
🚀 Quick takeaway
The tool choice is downstream of the variant scope. Server-side and feature-flag tests rule out the lighter client-side platforms, simple copy or layout tests run on any of the six.
Step 5: Running the A/B test (sample size and SEO-safe rules)
Step five is where most programs declare false positives, because the sample-size math feels optional until it isn’t. Two questions to answer before launch: how many participants do you need, and how long do you run.
Sample size. A defensible eCommerce default for a 5% minimum detectable effect at 95% confidence with 80% power is roughly 300 to 400 conversions per variant. The full formula:
n per variant ≈ 16 × p × (1 − p) / δ²
Where p is the baseline conversion rate (as a decimal) and δ is the absolute lift you want to detect. Worked example: a checkout step at 8% completion, looking for a 0.8 percentage-point lift (10% relative), gives n ≈ 16 × 0.08 × 0.92 / (0.008)² ≈ 18,400 visitors per variant. That is a four-week test at 700 daily checkouts.
If your traffic does not reach the sample in a reasonable window, the choice is to widen the detectable effect (run for a 20% relative lift instead of 10%) or move the test up the funnel where volume is higher. Do not lower the confidence threshold to 80% to make the math work, you are not running a test then, you are coin-flipping with a calculator.
Test duration. Run for at least two business cycles (two weeks for most eCommerce stores). Weekday and weekend behavior diverges enough that one-week tests routinely flip on day eight. A practical instance: in our Byggmax A/B testing case study, winning variants delivered +15% revenue once we held each test to a full two business cycles. HubSpot documents the same same-URL pattern: half the visitors see one version, half see the other, the same URL stays in front of both groups.
SEO-safe A/B testing rules. Three rules from Google’s testing guidance for search:
- Do not cloak. Show Googlebot the same content you show the corresponding user segment. Serving the control to bots and the variant to humans (or vice versa) is cloaking and risks a manual penalty.
- Use
rel="canonical". When the variant lives at a different URL (split-URL testing), point the canonical from each variant back to the original page so search engines consolidate ranking signals. - Use 302 (temporary) redirects, not 301. The redirect is temporary by design, the test will end and the original will return. A 301 tells Google the move is permanent, which is the wrong signal.
A clean A/B test is invisible to SEO. The risk only appears when the implementation cuts corners.
🚀 Quick takeaway
The sample-size math is the line between an experiment and a guess. If the formula gives a number you can’t reach, change the question, not the confidence threshold.
Step 6: Measuring the results
Step six closes the test and reads the result with the right statistical lens. Three concepts the team needs to share a common definition of:
Statistical significance. The probability that the observed difference between control and variant is not the result of random chance. The eCommerce default is 95% (a 5% chance of a false positive).
Statistical power. The probability the test will detect a real effect of the size you specified. 80% is the working default. Underpowered tests miss real winners.
Minimum detectable effect (MDE). The smallest variant-vs-control lift the test is sized to detect. Smaller MDE means larger sample, which means longer tests.
Most modern testing tools run the significance calculation automatically using either frequentist (z-test) or Bayesian methods. The team’s job is to read the output correctly: a 95%-confidence win with an interval of +2% to +22% is safe to launch, the same headline win with an interval of −1% to +25% is borderline and warrants a re-test. A homepage-level example of how a winning variant gets read off the data sits in our homepage value-proposition A/B test.
Document each test in a shared log: hypothesis, metric, MDE, sample size, duration, result, decision. Six months in, the log is the institutional memory the team uses to prioritize Step 3.
🚀 Quick takeaway
A 95%-confidence win with a tight interval is safe to release. A 95%-confidence win with a wide interval gets re-tested. The interval is the discipline most teams skip.
Step 7: Implementing the variant
Step seven ships the winning variant to 100% of traffic and starts the guardrail period.
Two questions to answer before the rollout: does the variant hold up across segments (mobile vs desktop, paid vs organic, new vs returning), and what is the primary metric expected to do over the next two business cycles. If the variant won on aggregate but lost on mobile, the right move is to roll out a mobile-specific variant instead, or hold the test until the mobile picture clarifies.
The guardrail period. Monitor the primary metric for at least two full business cycles after launch. Real wins hold their lift within the confidence interval, false positives revert. Schedule the check-in on the day the variant rolls out, do not leave it to memory. The hand-off into ongoing measurement is easier with shared dashboards, we cover the pattern in our live-mode A/B test dashboard guide (now Looker Studio).
After the guardrail period closes, the result feeds back into Step 1: the variant becomes the new control, the post-test data updates the friction map, and the next hypothesis on the prioritized backlog moves into build.
Frequently asked questions
What is website A/B testing?
Website a/b testing is a controlled experiment that splits live traffic between two or more versions of a page and measures which one performs better on a defined metric. Each visitor sees one randomly-assigned version, the assignment holds across sessions, and the result is read with a statistical test rather than a visual comparison of dashboards.
How long should I run a website A/B test?
A minimum of two full business cycles, which for most eCommerce stores is two weeks. The test also needs to reach its calculated sample size, whichever is longer is the actual duration. Stopping early on a day-three lift is the most common cause of false positives in eCommerce a/b testing programs.
What sample size do I need for an A/B test?
A working default for a 5% minimum detectable effect at 95% confidence and 80% power is roughly 300 to 400 conversions per variant. For exact numbers, use the formula n per variant ≈ 16 × p × (1 − p) / δ², where p is the baseline conversion rate and δ is the absolute lift you want to detect.
Is A/B testing bad for SEO?
No, not when implemented correctly. Run experiments per Google’s testing guidance, three rules: do not cloak, use rel="canonical" to point variant URLs back to the original, and use 302 redirects (temporary) for split-URL variants instead of 301 (permanent). For AI-search safe experimentation we also maintain an AEO playbook.
What is the difference between A/B testing and multivariate testing?
A/B testing isolates one change and measures one metric against one control. Multivariate testing (MVT) changes several elements at once and measures every combination, which needs far more traffic to reach significance. For most eCommerce programs the practical choice is a/b testing, MVT enters the picture only on high-traffic templates.
What tools replaced Google Optimize in 2026?
Google Optimize was sunset on September 30, 2023. The current 2026 tool stack is Optimizely Web Experimentation, VWO, Adobe Target, AB Tasty, Convert.com, and the open-source GrowthBook. Tool choice is driven by program scale, integration with the existing analytics stack, and whether the team needs server-side or feature-flag-driven experimentation.
Most A/B testing programs declare false-positive winners because they cut corners on prioritization, sample size, or the post-launch guardrail. Want an outside read on yours? Book an experimentation review with the scandiweb CRO team and we will pressure-test your backlog, your sample-size approach, and your tool fit against what we run across 1,000+ production tests.

Share on: