Welcome to part 6 and the final part of our Unified Commerce article series “Mastering Unified Commerce with Magento (Adobe Commerce): A Guide to Seamless Customer Experience.” In this article, we will discuss key metrics and analytics tools for measuring success in a unified commerce strategy with Magento (Adobe Commerce).
Navigating different sales channels can be a challenge. Yet, the bigger task is analyzing them and making informed decisions. To do this, retailers must have precise data from every aspect of their operations. Detailed reports, especially about stock, sales, and orders, are crucial. New growth avenues can be discovered by focusing on top-selling products, best customers, and effective deals. It’s also essential to use this data to identify early shifts in customer preferences. Unified commerce aims to offer a tailored shopping journey based on analysis of key metrics with the right analytics tools. By quickly adapting to the ever-changing market, retailers can maintain an advantage over competitors.
Importance of reports & analytics in unified commerce
Metrics visualized in reports serve as the backbone for any business, acting as tangible indicators of success and areas for improvement.
In unified commerce, these metrics take on an even more pivotal role. They guide business decisions and help fine-tune the entire unified commerce journey, while analytics provide the lens through which these metrics are viewed, driving informed strategies and ensuring that every customer interaction is optimized for the best possible experience.
Key metrics for measuring success in unified commerce
Unified commerce is a big leap for retailers. So, how do you know if it’s working? The answer isn’t just in sales numbers or customer feedback alone. It’s a mix of both, captured through key performance indicators (KPIs). KPIs offer a clear picture of what’s working and what might need a tweak. Besides, the real insights come from seeing how everything works together. A holistic view, combining both data and customer feedback, is crucial.
In this section, we’ll break down the metrics into three main areas:
- Customer metrics: insights into customer interactions and their satisfaction
- Sales & digital metrics: digital strategy effectiveness, sales trends, and performance
- Operational metrics: behind the scenes of your business operations.
Customer metrics
Customer Lifetime Value (CLV)
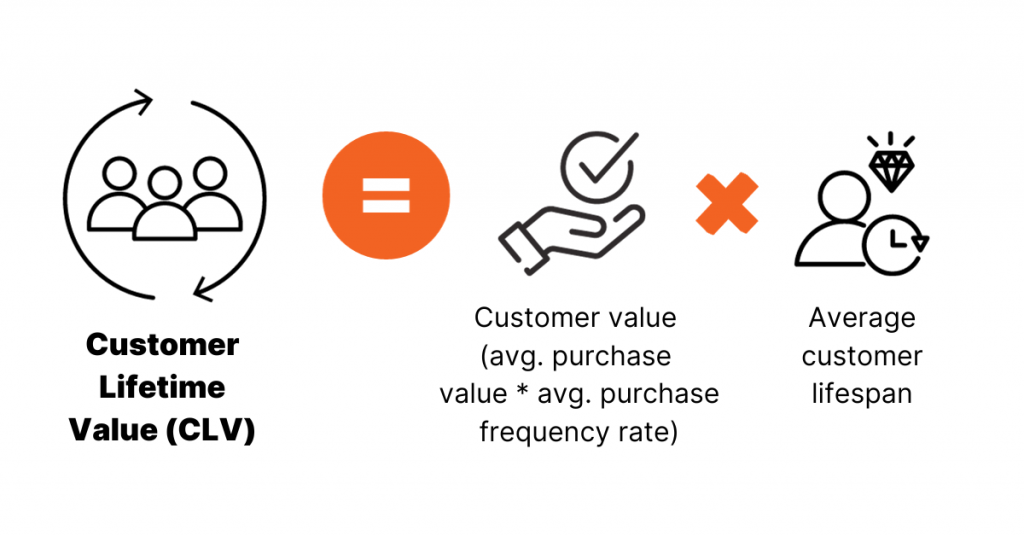
Customer lifetime value forecasts the total revenue a customer will generate during their entire association with a retailer. It is a testament to the revenue potential of an average customer.
Recognizing customers or specific segments with elevated CLVs is pivotal for shaping future strategies. Prioritizing and nurturing relationships with these high-CLV customers can yield excellent results in the long term.
Customer Retention Rate (CRR)
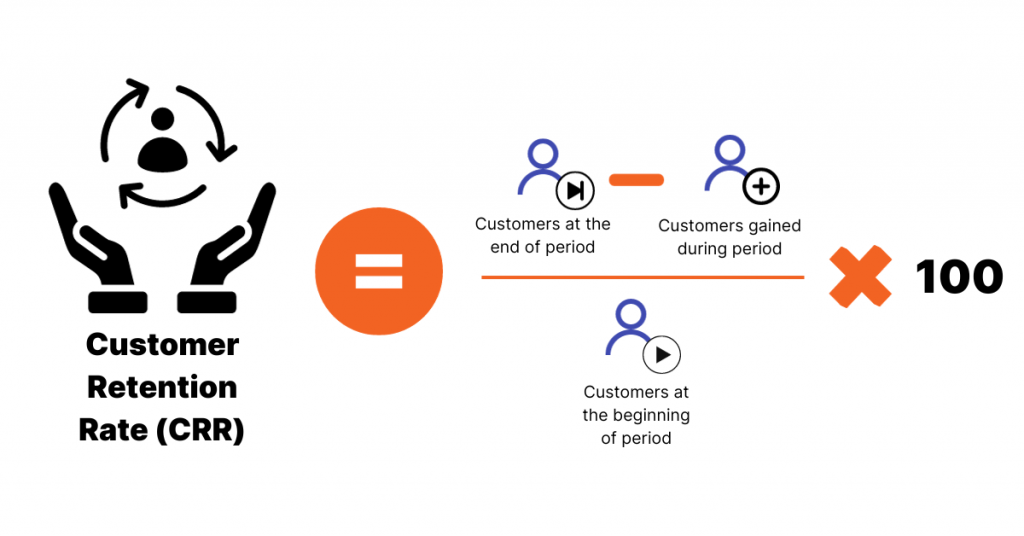
The customer retention rate shows how good a brand is at keeping its customers coming back. It tells you how often people return to buy something again. A high CRR means customers are happy with their shopping and want to return.
Having a lot of returning customers is great for business because returning customers buy more often, spend more when they shop, buy more during busy times like holidays, and tell their friends about your brand.
So, more returning customers mean more sales, saving money, and getting new customers through word of mouth. To keep this number high, businesses should:
- Work on providing great customer service
- Invest in a loyalty program
- Listen to customer feedback to fix areas of improvement
- Experiment with different communication channels and refine the existing ones.
Net Promoter Score (NPS)
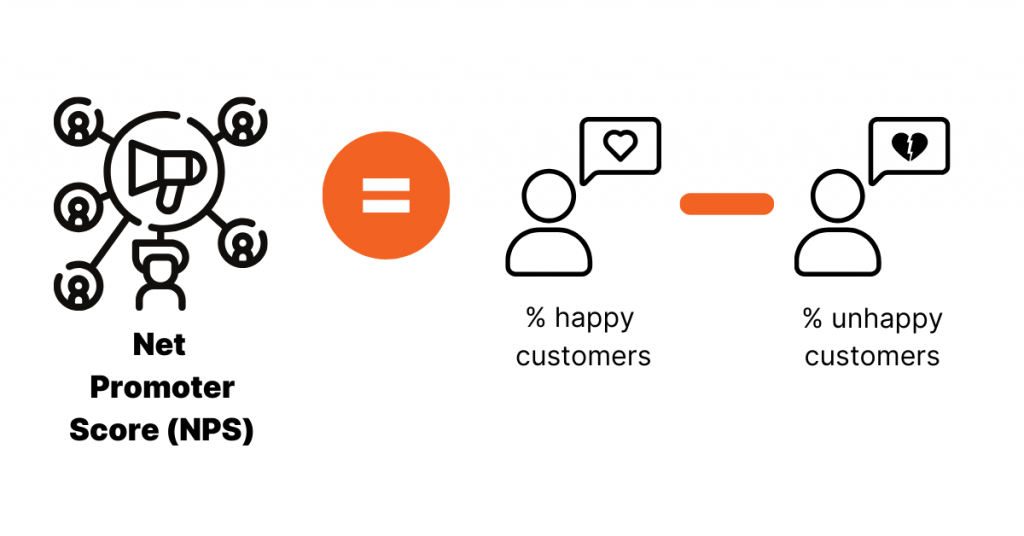
Net promoter score is a way to see how loyal your customers are and if they are happy. It’s simple—businesses ask their customers one question: “Would you tell a friend or coworker about our brand?”
You don’t need to wait for lots of sales data or expensive surveys. NPS tells you how people feel about everything you do, from your products to your website and staff. A high NPS means you’re doing great!
NPS also helps you see chances to do better and spots where there might be problems. Happy customers will buy more and tell others good things about you. Unhappy customers might warn others not to buy from you and leave bad reviews online. So, after asking the main question, you can also ask why they gave that answer. This helps you learn what you’re doing right and what you need to work on.
Sales & digital metrics
Average Order Value (AOV)
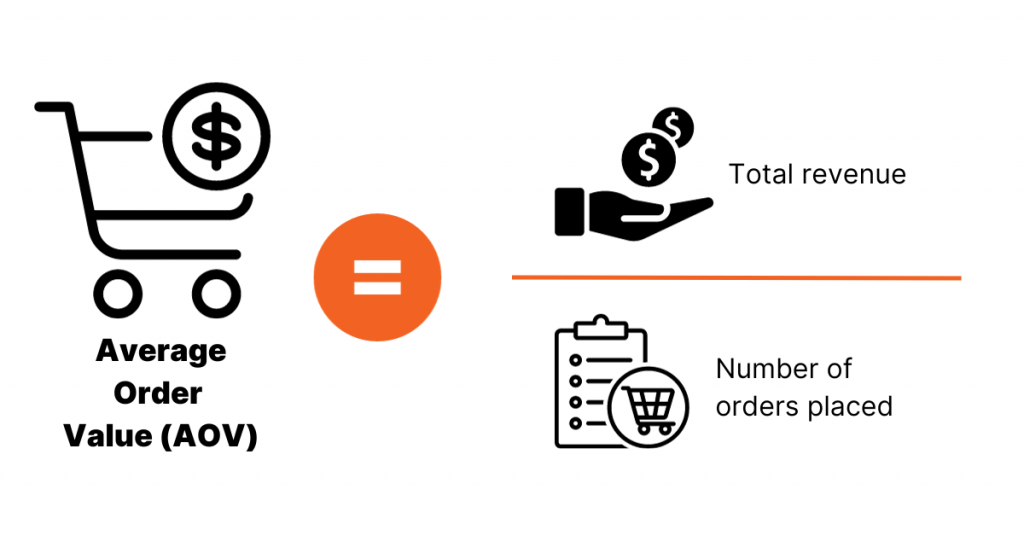
Average order value tells you how much a customer typically spends when they shop with you. It’s a simple way to see if people buy just one item or add a few more things to their cart.
AOV helps businesses understand their customers’ shopping habits. If the AOV is high, it might mean customers are finding more products they like or that good deals are encouraging them to buy more. If it’s low, customers could be just picking up what they need or testing your products for the first time.
By keeping an eye on AOV, businesses can adjust their marketing and sales strategies. For example, you might offer bundle deals or promotions to encourage customers to spend a bit more. It’s also a good way to see if changes to your website or store layout are helping customers discover more products they want to buy.
Conversion Rate (CR)
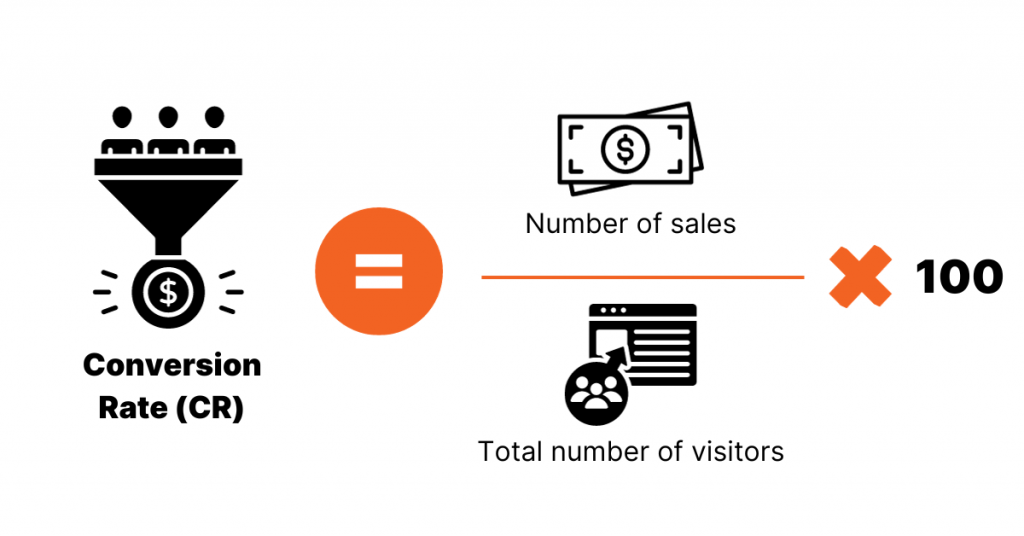
Conversion rate is all about seeing how well you turn people who visit your store or website into actual buyers. It doesn’t matter if they’re walking into your physical store or clicking around on your website; it’s about how many of them end up buying something.
Keeping an eye on CR is very important for any retailer. Think about it: if many people come to your store or website but only a few buy something, you’re missing chances to sell. A good CR means you’re doing a great job convincing visitors to become customers.
By watching your traffic and CR, you can learn a lot about your business. It can even give you ideas for big changes that could help you sell more. For example, if you’re thinking about changing your store’s appearance, adding more staff, getting different products, or having a sale, you can use CR to see if those changes help you sell more.
Customer Acquisition Cost (CAC)
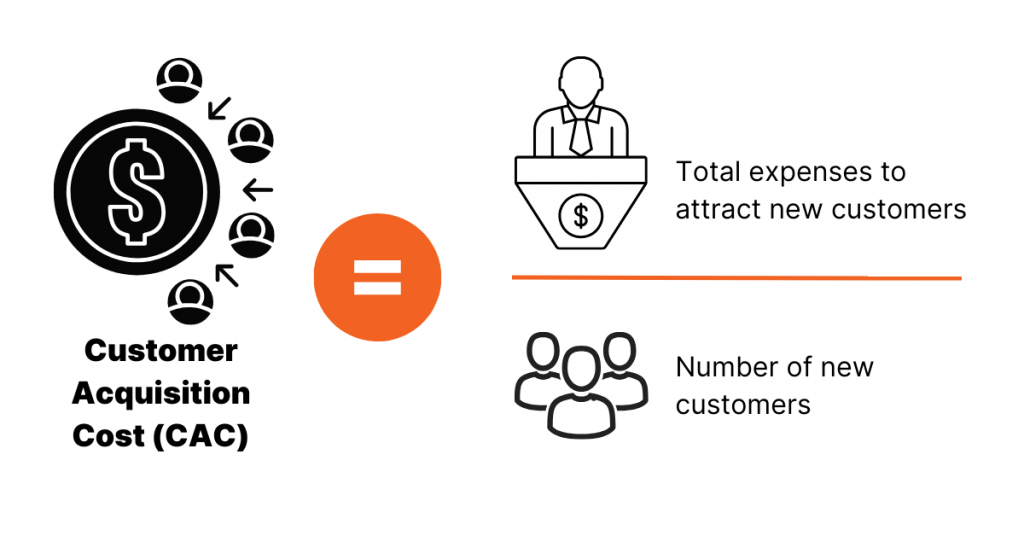
Customer acquisition cost is figuring out how much you spend to get a new customer. Every business might calculate it differently, but it usually includes costs like advertising, sales, marketing, getting the customer started (onboarding), and helping the customer (customer service).
CAC is a valuable number to know. It helps you see if the money you spend to get new customers is worth it. If your CAC is low, you’re doing a good job bringing new customers without spending too much.
It’s also great for comparing different ways you try to get customers. Maybe one type of ad or sales method is cheaper and works better than another. By looking at the CAC for each one, you can see which is the best deal for your money.
For businesses leveraging unified commerce, it’s important to keep CAC low. Here are some tips to do that:
- Make sure your online store has a good conversion rate
- Try to sell faster so you don’t spend as much time and money on each customer
- Have programs where happy customers can tell their friends about you
- Offer special deals or extras to make your products seem even better.
Rate of Returns (ROR)
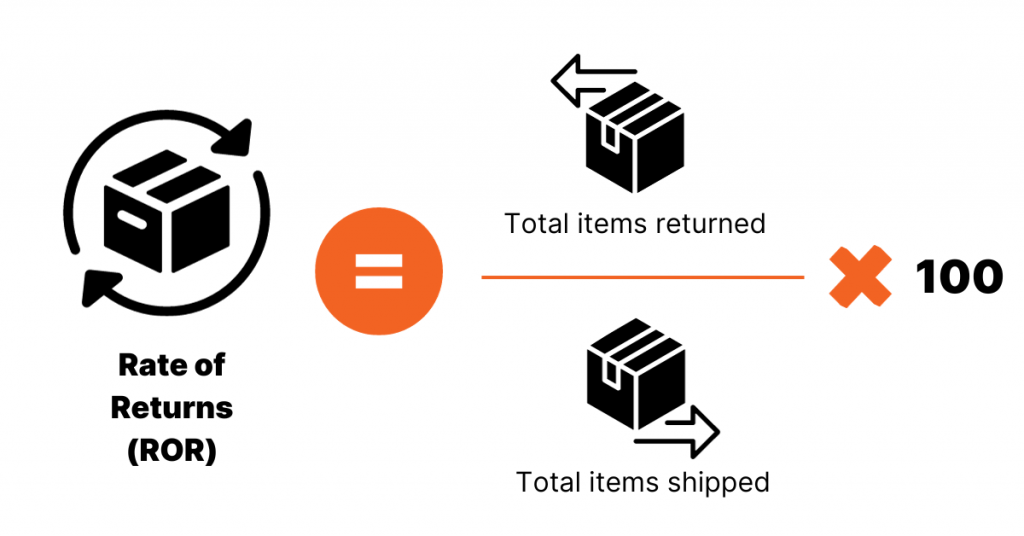
The rate of returns tells you how often customers send back what they bought from you. Hence, a high ROR isn’t good news. It usually means customers aren’t happy with what they have and might think twice before shopping with you again. Plus, when you get a lot of returns, you end up with items that aren’t selling—this takes up space and means you’re not making as much money as you could be.
Why people return items can help you determine what’s going wrong. Maybe there’s a problem with how something is made, or your ads are promising something that the product doesn’t do. By understanding these reasons, you can make changes. This might mean checking products more carefully, changing ads, or training your staff to help customers better.
Even though returns will always happen, it’s best to keep them as low as possible. Making sure customers are happy with their purchases is a big part of that.
Operational metrics
Inventory turnover
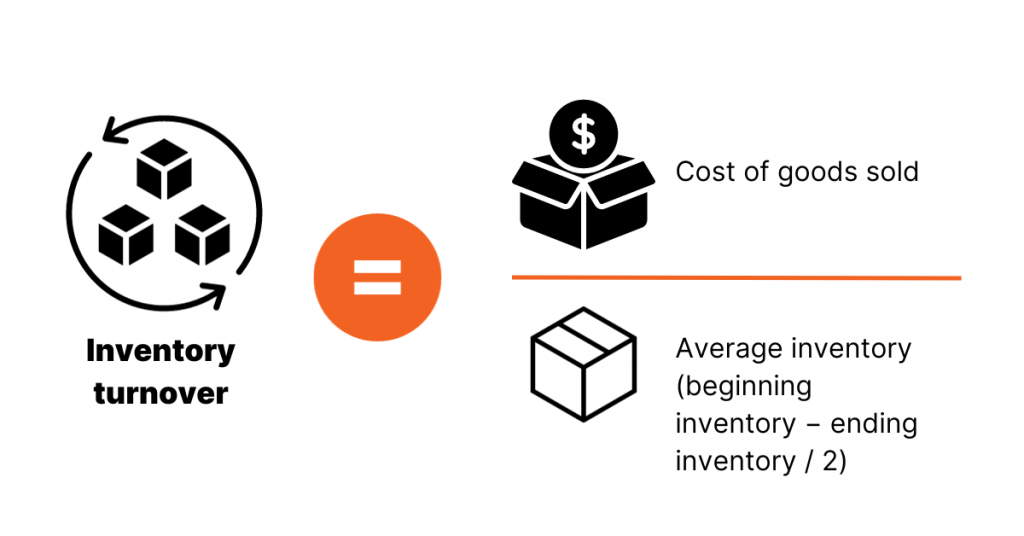
The inventory turnover rate shows how often you sell and restock everything you have in a specific time, usually a year.
If your turnover is low, it could mean that either people aren’t buying what you’re selling or you have too much stuff in stock. On the other hand, a high turnover might mean you’re selling a lot, which is great! But it could also mean you don’t have enough stock to meet demand.
Having items that don’t sell quickly can cost you money. They take up space, and you can’t replace them with new things that might sell better. By keeping an eye on inventory turnover, you can get a good idea of what people want to buy and make sure you have the right amount of stock.
Cost of Goods Sold (COGS)
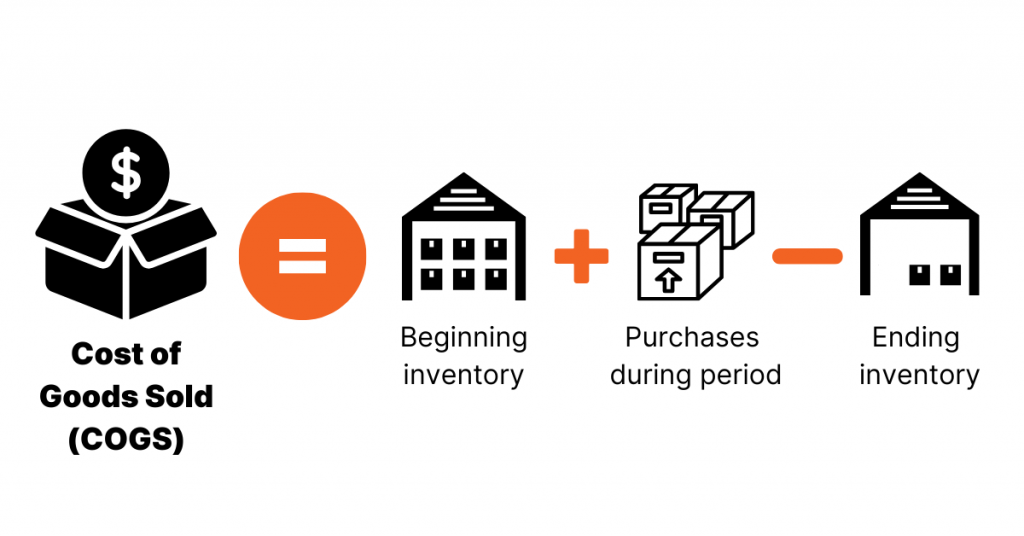
The cost of goods sold is about adding up all the money you spend to make your products. This includes things like materials and the cost of workers, but it doesn’t include other costs like shipping or paying your sales team.
COGS is an important number for unified commerce businesses. It helps you see how much it really costs to make what you’re selling. If the number is too high, you might be spending too much on making your products—this could mean you need to find cheaper materials or change how you make things. If you can’t cut these costs, you might need to consider charging more for what you sell or promoting products that cost less.
By knowing your COGS, you can also figure out other important numbers, like how much profit you make on each sale. It’s a good idea to keep this number as low as possible so you can make more money.
Gross profit margin
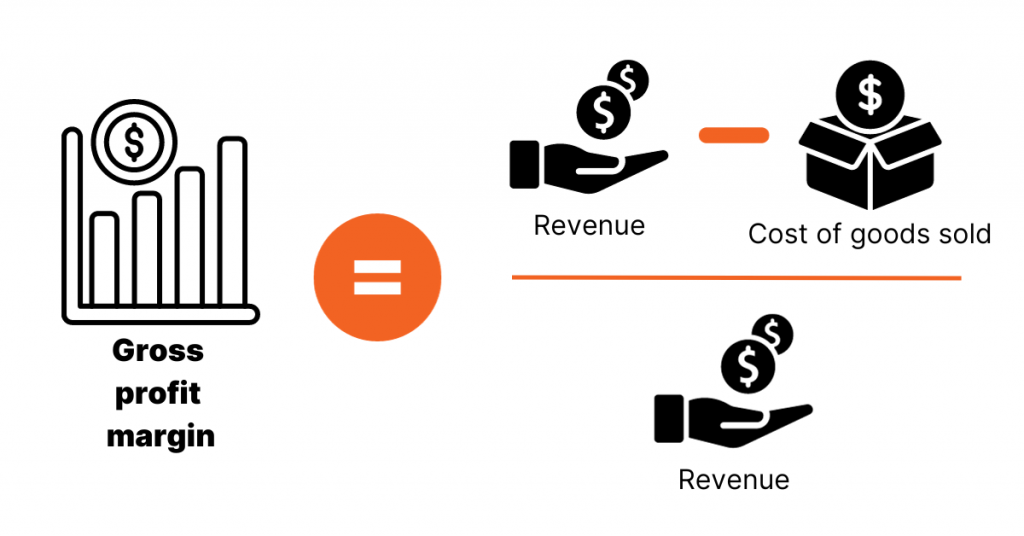
Gross profit margin is a way to see how much money you make is actual profit. It looks at more than just the money coming in—it also considers the money you spend on making and selling your products. This gives you a clear picture of how well your business is doing. For example, you might be selling a lot, but if it costs too much to make and market your products, you’re not really making as much profit as you think.
Let’s say you have a big sale. Lots of people buy from you, and you’re making more money. But you also spent money advertising the sale and maybe even lowered your prices. Gross profit margin helps you see if that sale was worth it.
In the end, a good gross profit margin means you’re keeping more of the money you make. This can help you decide whether to change your prices, spend less on making your products, or try a new way to sell. The goal is to have a high margin so you have more money left over after covering your costs.
Return on Investment (ROI)
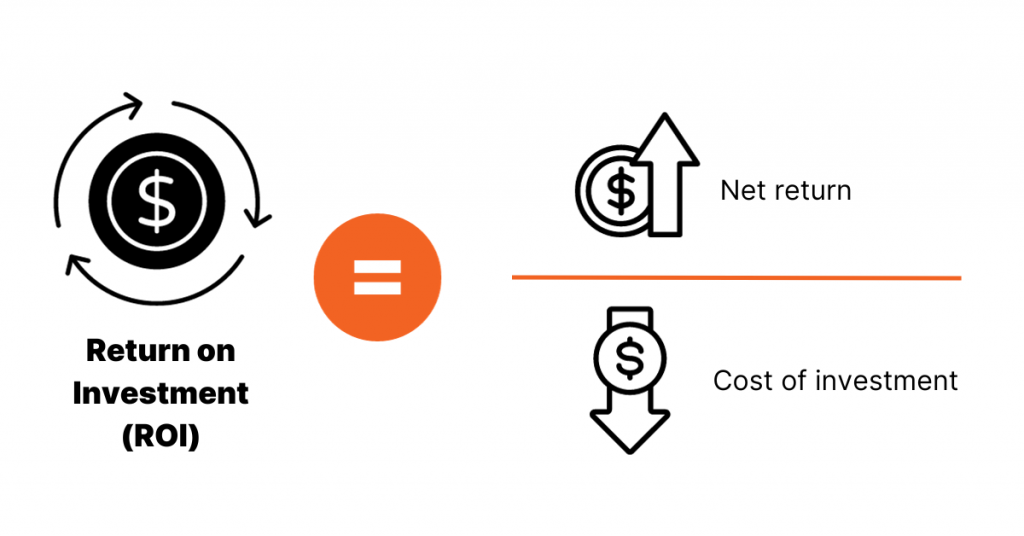
Return on investment is a way to see if the money you’re spending on your business is worth it. It’s all about comparing the profit you make to the money you spent to get that profit.
For example, if you spend money on a new ad campaign, you want to know if it brings in more customers and sales. ROI can tell you if you made more money from the campaign than you spent on it.
A high ROI means getting a good return for every dollar you spend. It shows that your investments, whether in marketing, new products, or other areas, are paying off. On the other hand, a low ROI might mean you need to rethink where you’re putting your money. You can make smarter decisions for your business by keeping an eye on ROI. It helps you see where to spend more and where to cut back. The goal is always to get the most profit for the least amount of spending.
Data collection for KPIs
KPIs give you a snapshot of how your business is doing. But just having a list of KPIs isn’t enough. To make a difference and improve, you need to pick the right KPIs and know how to use them to guide your decisions. I.e., you need to gather data all the time from different places. By always collecting fresh data, you can stay up-to-date and ensure you’re giving customers what they want.
One of the best ways to get this data is by paying attention every time a customer interacts with your business. In unified commerce, there are several touchpoints where you can learn something about your customers. The most important ones are:
- eCommerce store—transactional data, customer feedback, mobile app data
- Point of sale (POS)
- Social media—recommendations, referrals, brand mentions, polls
- Call centers.
Magento (Adobe Commerce) analytics tools
As we’ve discussed, KPIs offer valuable insights into your operations, from customer interactions to sales metrics. But to effectively track and analyze these KPIs, you need the right tools.
Magento (Adobe Commerce) provides powerful analytics tools to help retailers dive deep into their data, make informed decisions, and optimize their unified commerce strategy. Whether you’re looking to gain insights from Adobe’s analytics platform, integrate with Google Analytics, create tailored dashboards for specific metrics, or bring in third-party tools for specialized analysis, Adobe Commerce has got you covered.
Adobe Analytics
Adobe Analytics, a key component of the Adobe Commerce suite, offers retailers a comprehensive view of their business performance. This tool goes beyond basic data collection, providing real-time insights into customer behaviors, preferences, and interactions across multiple channels. With features like predictive analytics, segmentation, and customizable dashboards, businesses can tailor their analysis to focus on the most relevant metrics.
It empowers retailers to make data-driven decisions, optimizing marketing campaigns, and enhancing the overall customer experience. By understanding and reacting to customer behavior, retailers can improve customer satisfaction and drive increased sales and revenue.
Google Analytics integration
Google Analytics, a widely recognized analytics platform, can be seamlessly integrated with Adobe Commerce to provide retailers with additional insights. The integration process is straightforward, typically involving the addition of a tracking code to your website, allowing data to flow from your Adobe Commerce platform to Google Analytics.
Once integrated, retailers can tap into a plethora of metrics that Google Analytics offers, from tracking website visitors and understanding their behavior, such as pages viewed and time spent, to diving deep into eCommerce-specific metrics like cart abandonment rates, conversion rates, and sales performance. Google Analytics also provides insights into traffic sources, helping retailers understand which marketing channels drive the most traffic and conversions.
The combination of Adobe Commerce and Google Analytics offers a comprehensive view of the customer journey and business performance. By leveraging the strengths of both platforms, retailers can gain a deeper understanding of their audience, optimize their marketing strategies, and enhance the overall shopping experience for their customers.
Custom dashboards
Custom dashboards are all about flexibility and personalization. Retailers can design their dashboards within Adobe Commerce to highlight key performance indicators, from sales figures and customer interactions to inventory levels and marketing campaign results. Instead of sifting through heaps of data, these dashboards provide a concise and clear view, making it easier to spot trends, challenges, and opportunities.
This way, you can save time by presenting crucial data at a glance, enabling quick decision-making and allowing for real-time monitoring of business performance.
Third-party tools
Magento’s (Adobe Commerce) versatility extends to its compatibility with various third-party analytics tools. Recognizing that businesses have diverse needs and preferences, Adobe Commerce allows for easy integration with different external platforms, ensuring retailers have a holistic view of their operations.
Conclusion
Tracking KPIs stands as a cornerstone for success in unified commerce. These metrics serve as a compass, guiding retailers in assessing the quality of the customer experience and the efficiency of their business operations.
However, it’s not just about selecting universal metrics; it’s about tailoring them to fit the unique workflows and nuances of your business. Magento (Adobe Commerce) and its array of analytics integrations can equip retailers to dive deep into data, drawing out actionable insights.
Ready to elevate your unified commerce strategy? Navigating omnichannel retail can be complex, but you don’t have to do it alone. Reach out to our strategists today, and let’s unlock the full potential of your eCommerce journey!
The Unified Commerce series
- Part 1: Embracing Unified Commerce with Magento (Adobe Commerce)
- Part 2: Unified Commerce with Magento (Adobe Commerce): Best Practices and Case Studies
- Part 3: Integrating Your Sales Channels with Magento (Adobe Commerce)
- Part 4: Enabling Personalization in a Unified Commerce Strategy with Magento (Adobe Commerce)
- Part 5: Data Centralization: Unlocking Unified Commerce Success with Magento
- Part 6: Measuring Success in Unified Commerce with Adobe Commerce: Key Metrics and Analytics Tools—you are here!

Share on: