Google Data Studio allows an easy build of customized reports, data visualizations and dashboards using your GA data. There might be some limitations at first glance, though.
Let’s say you’re in need of detailed insights to understand the differences between the performance of segment VS overall website performance. You soon realize the DS native segment functionality isn’t designed for applying several segments to a single table.
Data Studio does, however, have such functionality as data blending — with that it’s possible to add a standard metric in one column and the same metric only with filter/segment applied in another column within the same table. This functionality can be used to compare two or more segments.
Follow the instructions below to learn how you can use the data blending feature to compare multiple GA segments in the same report’s table.
Instructions, based on an example
Task: Create a table with 2 metrics next to one another
column_1 = amount of all sessions
column_2 = amount of sessions from only Organic traffic
How to make this happen?
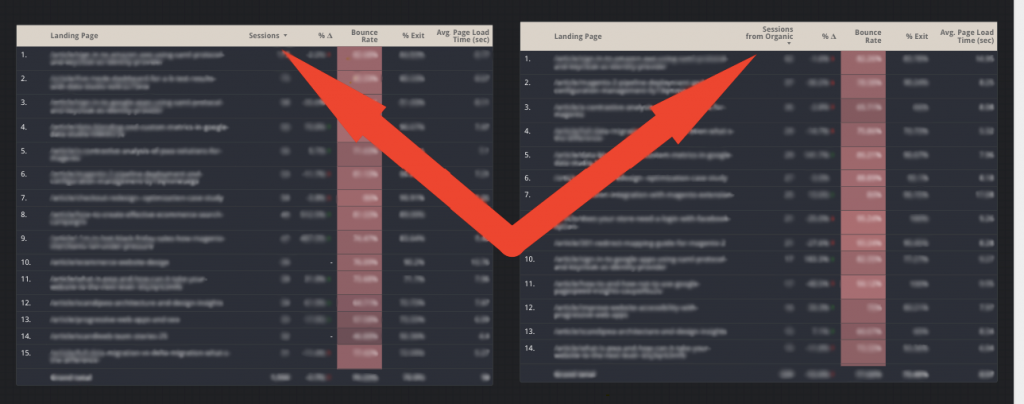
1. Create two tables — 1 with standard metric and 1 with the same metric + filter
2. Rename this metric, so you would recognize it

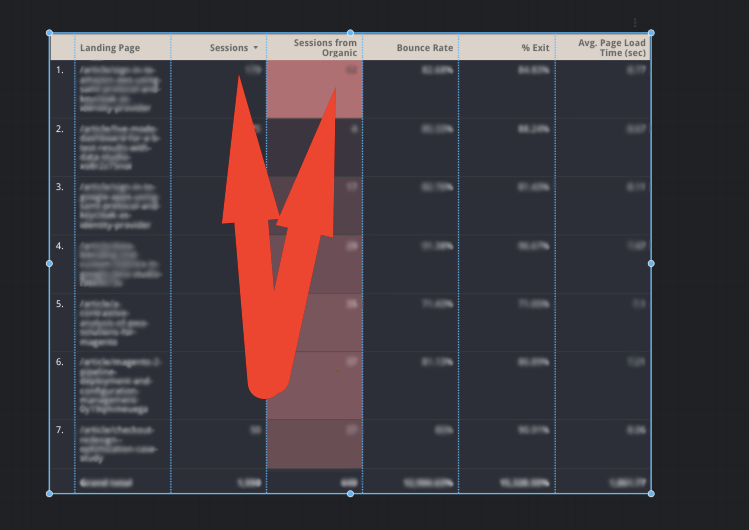
3. Select both tables, press the right-click on the selection and choose “Blend Data”
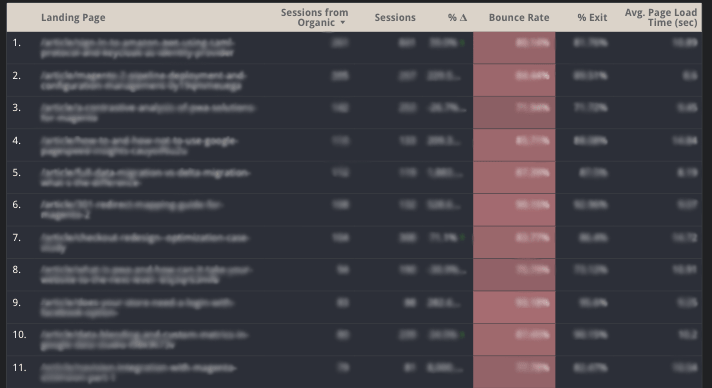
4. There you go, a new table with both metrics!

Don’t forget to clean the table and leave the needed metrics!


Share on: