When you work as a conversion rate optimization specialist nothing is more exciting than an A/B test. It is the moment of truth that reflects all your hard work with the different kind of researches and brainstorm sessions to find the key improvement that will make your website better.
To make a decision whether the test hypothesis is true or not you should follow a report which most likely is provided by the A/B test tool used. However, these reports have limits and it is not always possible to track the data you would like to analyse. What’s more, sometimes the A/B test set-up can be so specific that the standard report would not show correct data. The solution is evident— create custom reports.
In the next paragraphs, I’ll explain my approach of how to make a custom report by using Google Analytics (GA), GA Add-ons and Data Studio (DS).
The A/B test experiment
Recently our team performed an A/B test on mobile and tablet devices with Google Optimize (GO). The idea was simple — originally, when a user added a product to their cart, a notification without any links popped up, but for our proposed variation — a pop-up with 3 elements would appear — a Continue to Checkout button, as well as Edit Cart and Continue Shopping text links (see image below).
Due to certain limitations, the experiment was activated not when the Add to Cart event was fired, but when the productDetail event was pushed. Since the purpose of the variation was to increase the cart-to-checkout rate, the conversion was counted when a user visited the Checkout and the Checkout event was fired.
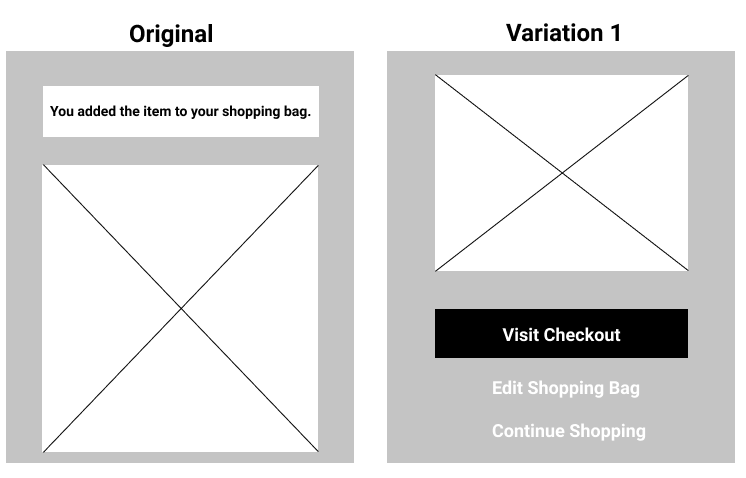 Wireframes of the experiment
Data Tracking version 1 — Data Studio
Because of the non-standard activation, we could forget about GO data and focused on GA Experiment data when an appropriate custom segment was applied — it consisted of experiment number, sessions from mobile and tablet devices and Add to Cart events. Also, our team is a big fan of Data Studio and an easy-to-understand dashboard is not a thing to overlook when future actions will be based on data in the report.
One of the main advantages of DS is automated reports. So with an idea that we just should connect the report with the correct source, create few scorecards and a table with devices, we started to prepare a dashboard.
The first issue we faced was with scorecards. Yes, it is easy to add a metric with sessions included in the experiment, a bit more difficult to add a metric with conversions, but it is impossible to create a custom formula when both metrics have different segments applied, so conversion rate would be calculated.
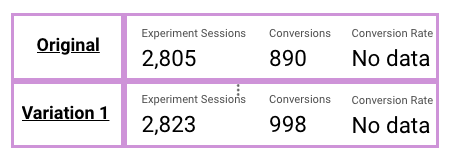 Data Studio scorecards with “No Data”
The second issue was regarding the table and sessions. The idea was simple — include device type, variant and sessions, conversions and other eCommerce metrics. When we applied the segment, the amount of sessions per device showed “conversions” instead of all sessions included in the experiment. At the same time, the Grand Total field showed all sessions included. Check the table below to see how the issue looks on DS.
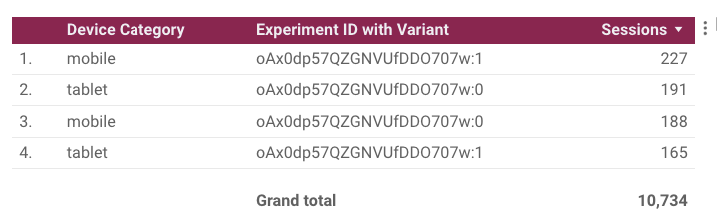 Sessions and Conversions by Device Type and Experiment Variant in Data Studio
Data Tracking version 2 — Data Studio + Google Sheets + GA Add-ons
Knowing that we would need to do other custom calculations, it was decided that it is time to connect Google Sheets and GA Add-ons.
The first step was to create segments that would include the experiment ID + Variant, tablet and/or mobile device type and sessions with the Add to Cart event. In total 6 segments were made.
The next step was to create the rules for GA Add-on reports. Of course, it is not necessary to make a separate report for every device or filter. However, in this situation, I preferred to make it like that, so in case of questions, I could quickly find the answer. Therefore, in total, we had a sheet with 12 reports that contained different segments, filters, dimensions and metrics to track.
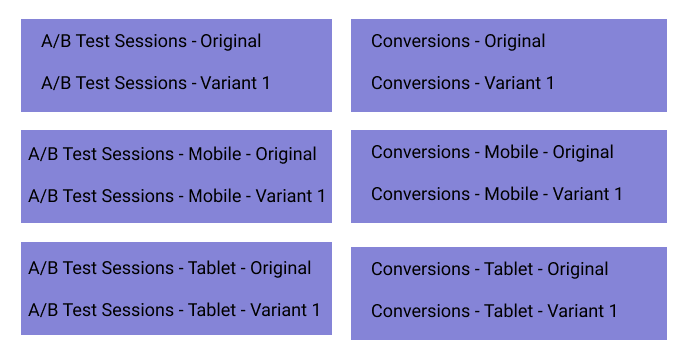 Structure of the reports to create
Another thing to notice is the method used for tracking conversions. As explained, the conversion was registered when the Checkout event was sent. At first, I created a report with a test-specific segment and included a filter with eventAction Checkout, the same as in GO to count conversions. It did not work. Luckily for us, Google has a great Enhanced eCommerce dimension “Shopping Stage” with a component “Checkout”, so I included a filter based on it and it did work as expected.
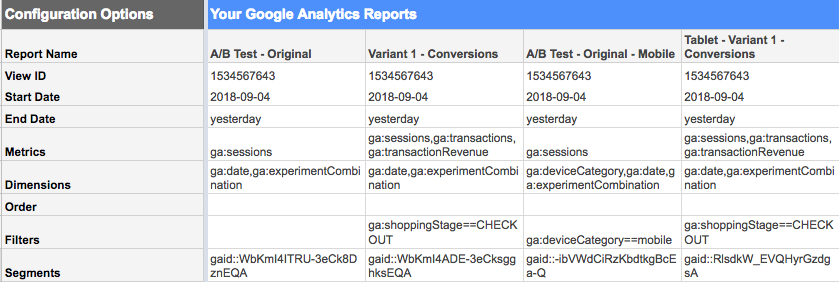 Example of Google Add-ons Report Configuration tab
When the structure of how everything works and should look was clear, things got much easier — we started to run the Add-ons reports and prepared tabs with custom calculations and connected them with Data Studio.
Since we didn’t have a correct dashboard in GO for checking how the experiment is doing from the perspective of statistical significance, we found statistics specific formulas and included the calculations in the spreadsheet and later in the Data Studio report.
 Custom Calculations in Google Sheets
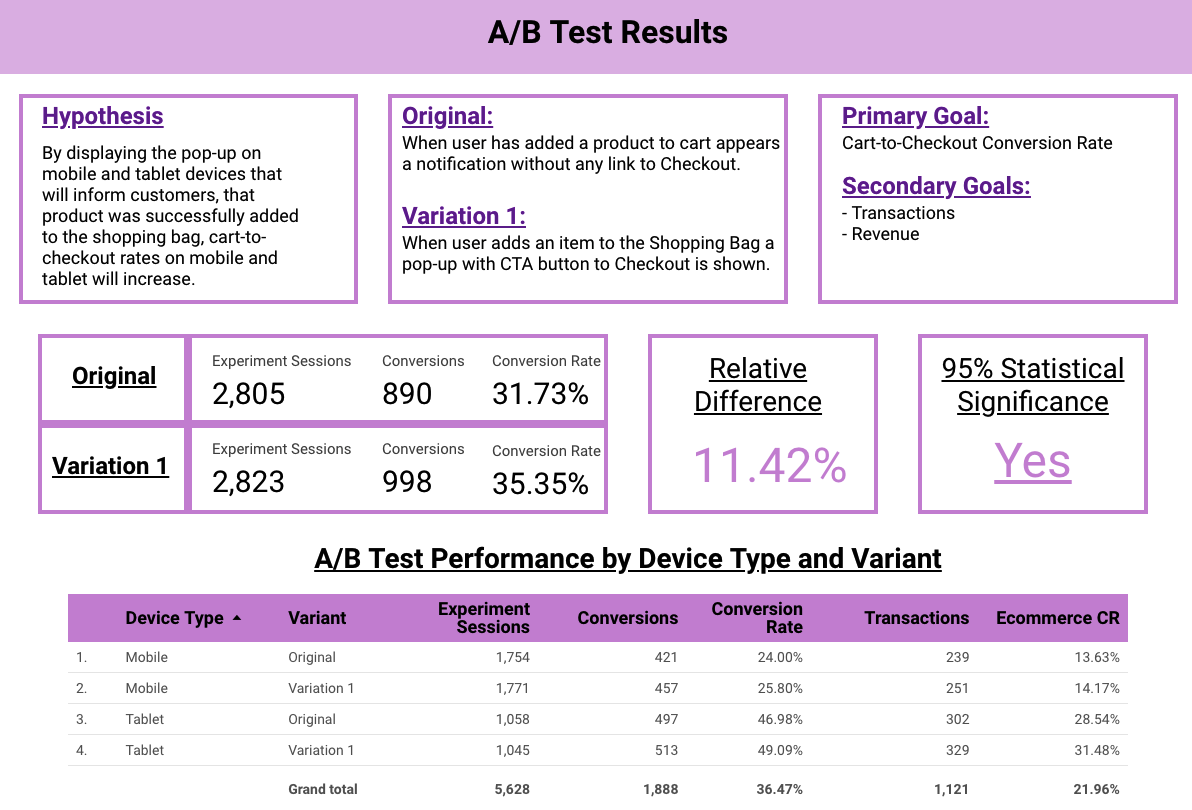
Finally, to make the dashboard usable for the client, we added new text fields with test hypothesis, description of variants, goals to track and approximate test duration.
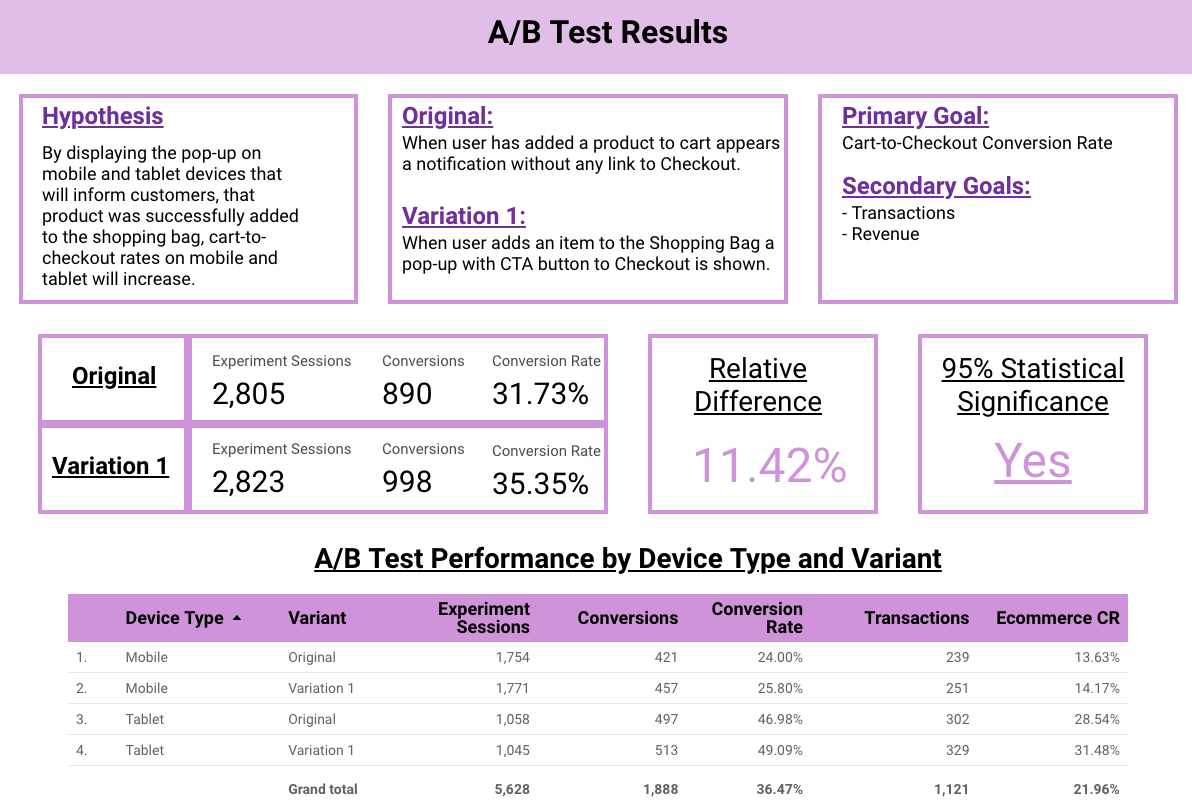 A/B Test report in Data Studio
Here you can find a link to sample of our report.
If you are interested in using the template – make a copy, add your sources and adjust other details. Just remember, the report was made via GA Add-ons, hence you will still need to prepare all calculations in Google Sheets.
Post-report-making thoughts
There are not many situations when a problem has only one solution. The same is with methods for preparing reports — there can be many ways how to find the same data. Because of that, the methodology described above should not be found as the only and the most effective one. However, it worked for us and I hope it will help others as well.
Check more conversion rate optimization possibilities here!
If you have any thoughts or suggestions, comment below or write us at [email protected]!


Share on: