
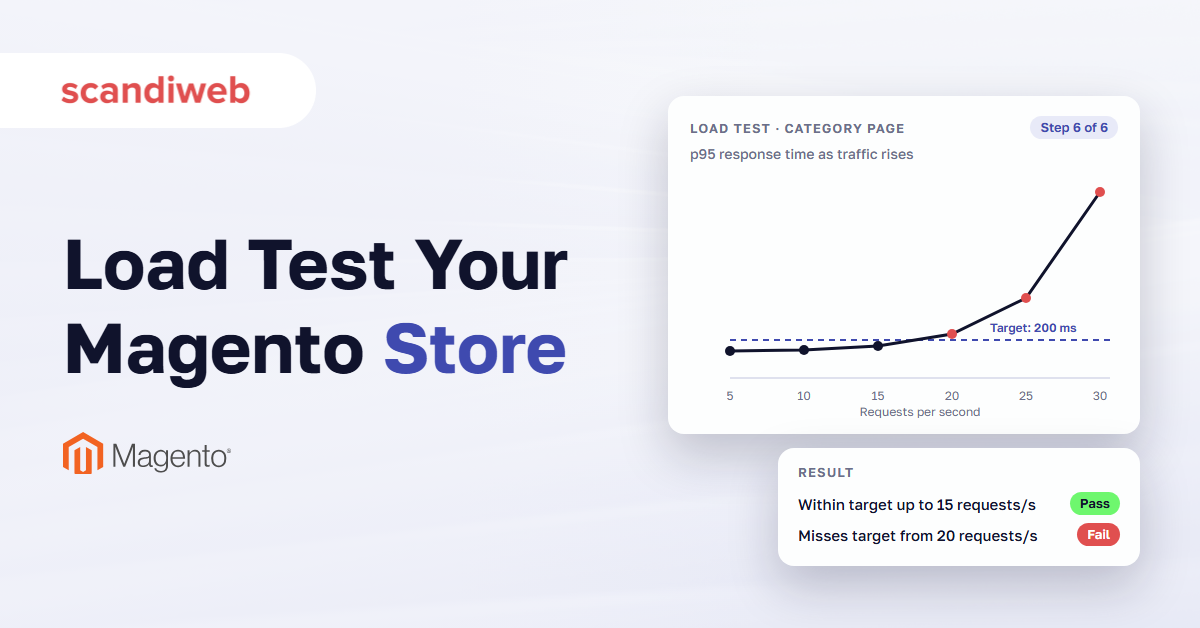
You can find out how much traffic your Magento (Adobe Commerce) store can take before a big sale, while there is still time to fix what breaks. That is the job of Magento load testing: a tool sends the store a crowd of simulated shoppers, adds more of them step by step, and records the point where pages start to slow down.
Magento used to come with that test built in. Up to version 2.4.5, every install carried scripts for JMeter, a free load-testing program, in a folder called the Magento Performance Toolkit. Adobe removed the scripts in version 2.4.6, released in March 2023. The folder now does one job: it fills a test copy of your store with products, customers and orders. The traffic comes from a tool you pick, such as JMeter or k6, another free tool, aimed at a copy of the store that matches the live one.
What is Magento load testing?
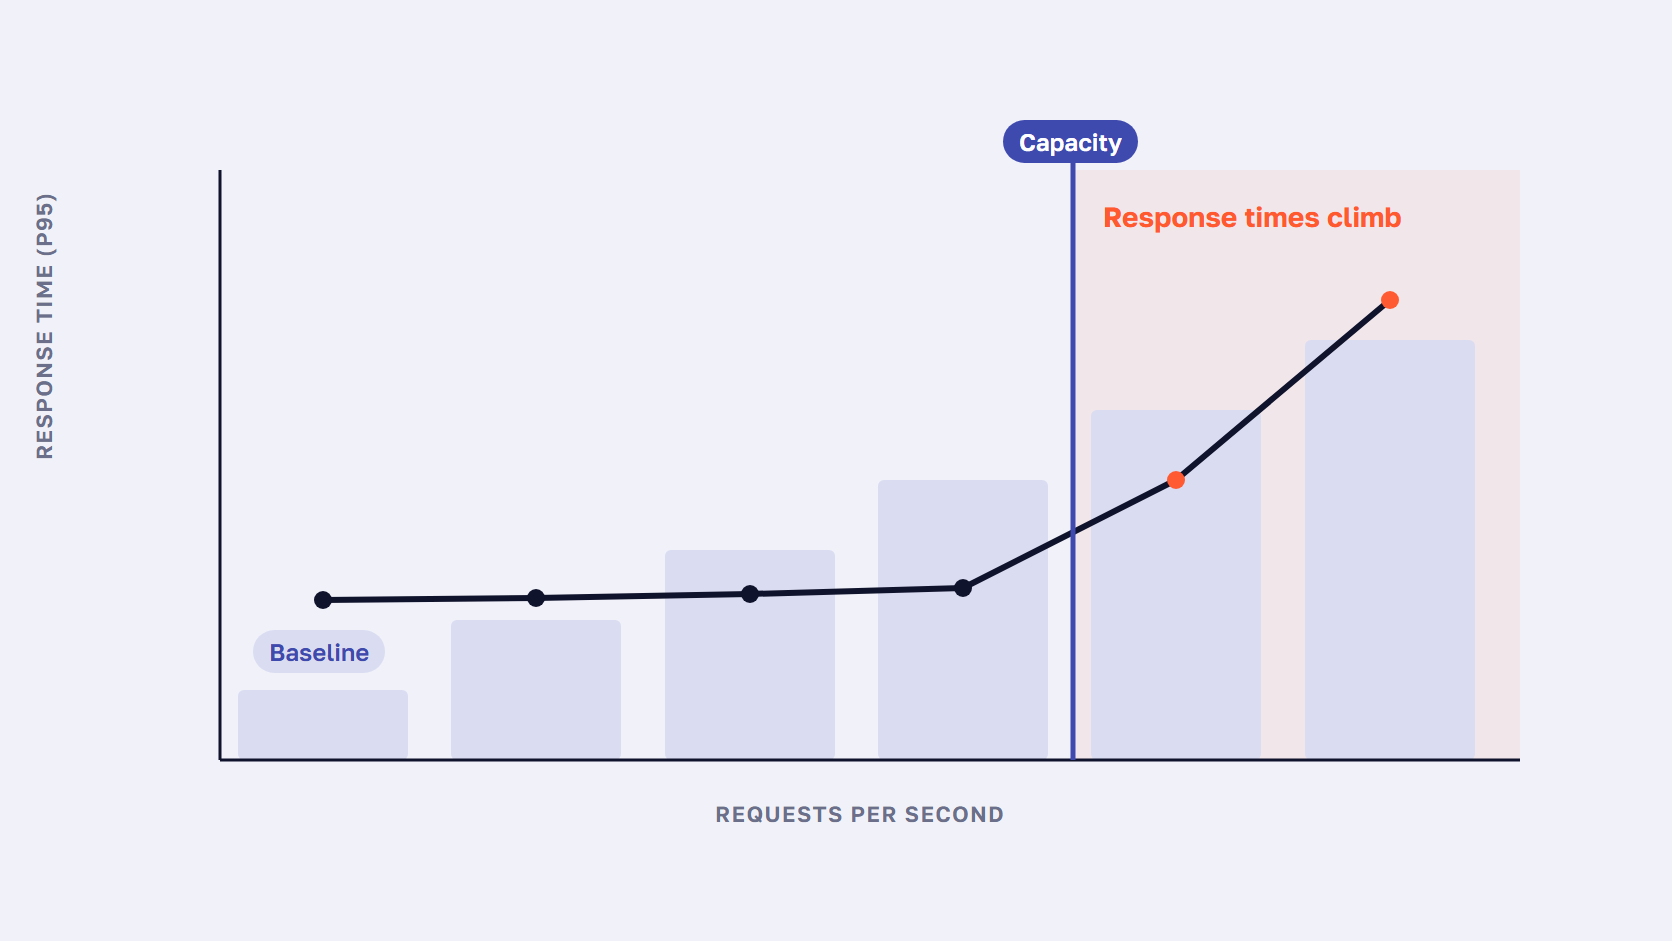
Magento load testing sends a copy of your store many simulated shoppers at once and raises the traffic in steps while it measures three numbers: requests per second, response time and errors. The result is your store’s capacity, the traffic level where response times start to climb, which you then compare with your real peak.
Three numbers describe each step of the test. Requests per second is how many requests, mostly page loads, the server answers each second. Response time at the 95th percentile, or p95, is the time that 95 out of every 100 requests beat, so a few slow pages can’t hide behind a good average. Single-page server timing is covered in our guide to reducing server response time. Error rate is the share of requests that fail or time out.
Plot p95 against traffic and the line stays nearly flat, then bends upward as the server runs short of something: CPU, PHP workers or database connections. The bend is the store’s capacity.
Load testing is one part of Magento performance testing, and timing single pages for one visitor comes first. The load test tells you how long those timings hold once the crowd arrives.
Load test vs stress test
Adobe’s testing guidance for Commerce on Cloud separates the two. A load test measures response times and errors under the load you expect, for example a set number of concurrent users who each complete a set number of transactions in a set time, and it shows the response time of the transactions that matter to the business. A stress test pushes past that, to see whether the system still performs “when the current load goes well above the expected maximum”. Run the load test first, then keep raising the traffic into a stress test to see what breaks first.
🚀 Quick takeaway
Track response time at the 95th percentile. An average can stay calm while one request in twenty waits several times longer, and those slow requests are often for pages Magento has to build from scratch.
What the Magento Performance Toolkit does today
The Magento Performance Toolkit is a folder that comes with Magento 2 at setup/performance-toolkit. Today it generates test data: one command fills a store with products, categories, customers and orders in one of five sizes, from small to extra large. Up to Magento 2.4.5, it also held JMeter load-test scripts, which Adobe has since removed.
It gives you half of a load test: a store full of data. The traffic comes from somewhere else.
The five profiles and what they generate
Each profile is an XML file that sets how much of everything the generator creates. Adobe’s profile table gives these values:
| Profile | Websites / store views | Simple products | Configurable products | Categories | Customers | Orders |
|---|---|---|---|---|---|---|
| Small | 1 / 1 | 800 | 16 | 30 | 200 | 80 |
| Medium | 3 / 3 | 24,000 | 640 | 300 | 2,000 | 50,000 |
| Medium multi-site | 25 / 50 | 4,000 | 879 | 100 | 2,000 | 50,000 |
| Large | 5 / 5 | 300,000 | 8,000 | 3,000 | 5,000 | 100,000 |
| Extra large | 5 / 5 | 600,000 | 16,000 | 6,000 | 10,000 | 150,000 |
Source: Adobe’s profile table. Configurable products have 24 options each, except 79 of the medium multi-site ones, which have 200.
Pick the profile closest to your catalog: medium has 24,000 simple products, large has 300,000, and medium multi-site suits a store that runs many websites and store views from one install. A sanitized copy of your own data is better when you can use it, because your own attributes and extensions shape the work Magento does on every page.
How to generate the test data
bin/magento setup:performance:generate-fixtures -s setup/performance-toolkit/profiles/ce/medium.xml
bin/magento indexer:reindex
Use profiles/ee on Adobe Commerce. Disable cron jobs before you start.
Adobe’s instructions say to disable all cron jobs before the generator runs and to reindex when it finishes. The -s option skips the reindex, so the generator needs fewer resources, though the total time doesn’t drop. Adobe’s docs write the command as setup:perf:generate-fixtures, the same command in its short form.
The toolkit’s README for 2.4.5 said the large profile can take up to 4 hours, and that medium or large may need MySQL tmp_table_size and max_heap_table_size of 512 MB or more and a PHP memory_limit of 1 GB or more. Run it on a throwaway copy, never on production, since it writes products, customers and orders into whatever database it points at.
What happened to the JMeter scripts
Up to Magento 2.4.5, the folder also held two JMeter scripts, benchmark.jmx and benchmark_2015.jmx, that imitated shoppers browsing, searching, adding to cart and checking out, plus admin users. Adobe removed both in August 2022, and Magento 2.4.6, released in March 2023, was the first release without them. Some guides still describe them as part of every install.
The 2.4.5 versions are still in the 2.4.5 toolkit folder on GitHub, with a README that explains each setting, so they work as a template. They were written for older releases, so check every request against your store before you trust a result.
🚀 Quick takeaway
The Performance Toolkit’s data generator writes test products, customers and orders into the database it runs against. Point it at a throwaway copy of the store, never at production.
Load testing tools for Magento: JMeter, k6, Gatling and Locust
The common load testing tools for Magento are JMeter, k6, Gatling and Locust. All four are free and open source. They differ mainly in how you write the test: JMeter in a visual editor, k6 in JavaScript, Gatling in Java or JavaScript, and Locust in Python. Pick the one your developers already read and can maintain.
| Tool | How you write a test | License | Worth knowing for Magento |
|---|---|---|---|
| Apache JMeter | Visual editor, saved as a .jmx file | Apache 2.0 | Adobe’s old toolkit scripts were JMeter files. Build in the editor, run from the command line. Needs Java 8 or later. |
| Grafana k6 | JavaScript | AGPL-3.0 | Can start requests at a set rate, whatever the store’s response time |
| Gatling | Java, JavaScript or TypeScript | Apache 2.0 | Tests live as code, next to the store’s code |
| Locust | Python | MIT | Can spread one test across several machines |
The install steps are on the home pages of Apache JMeter, Grafana k6, Gatling and Locust. Adobe’s Cloud testing guide also lists Siege, and New Relic, which watches the server while a load tool sends traffic. The two answer different questions: the load tool shows when the store slows down, and monitoring shows why.
Set the load in requests per second
Most tools start a number of virtual shoppers, and each one waits for a page before asking for the next. When the store slows down, each of them asks less often, so the test eases off exactly when it should push. k6’s documentation on open and closed models puts it plainly: when the system under test starts to respond more slowly, a closed-model test waits.
The fix is an open model. Requests start at the rate you set, whatever the store’s response time, so a struggling store gets the same traffic as a healthy one. In k6 that is the ramping-arrival-rate executor. Other tools may offer something similar, so check your tool’s documentation for an open model or an arrival rate. Read your results in requests per second, the unit the Expedio benchmark below also reports.
🚀 Quick takeaway
A test with virtual shoppers who each wait for a page before asking for the next sends fewer requests as the store slows down, so a struggling store looks healthier than it is. Set the load in requests per second instead.
How to run a Magento server load test, step by step
To run a Magento server load test:
- Build a test copy that matches production.
- Pick the pages and journeys to test.
- Measure a baseline at low traffic.
- Raise the requests per second in steps.
- Find the step where response times bend upward.
- Change one thing and run the same test again.
1. Build a test copy that matches production
Match production on server size and count, Magento version, extensions, theme, PHP version, cache setup (Varnish, and Valkey or Redis) and search engine. Check the versions against the Magento 2 system requirements for your release. For data, use a sanitized copy of production with personal data removed, or the Performance Toolkit profile closest to your catalog size. Run the load tool from a separate machine, so it doesn’t compete with the store for CPU. If production adds servers when traffic rises, as with server autoscaling in Magento 2, decide whether the test copy should do the same: with it on you measure the cluster, with it off you measure one server.
2. Pick the pages and the cache setting
Use real URLs from your catalog: category pages, filtered categories, product pages, searches and the cart. Add logged-in journeys, since each customer group gets its own cache copies, so logged-in pages miss the cache more often. Run once with the Magento full page cache on, the way shoppers get the store, and once with it off, to see what the server can build on its own, which is the load it faces after a deploy or a cache flush. On Adobe Commerce Cloud, Fastly is the full page cache.
The old toolkit script’s cache-hit setting defaulted to 100%, so out of the box it measured a store where every page came from the cache. For a sale, the target, the traffic mix and the pass criteria are in our Black Friday load-testing plan.
3. Measure a baseline at low traffic
Run one or two requests per second for a few minutes and record p95 per page type. At this level, your numbers should match the single-page timings you get when you audit Magento performance. If the cache is on, refill the top pages first with a cache warmer or a scripted crawl, or the first minutes measure an empty cache. As a sanity check, Adobe says that with Varnish working, cacheable pages load in less than 150 ms.
4. Raise the load in steps
Increase the rate in steps, doubling it each time for example, and hold each step for a few minutes, long enough for the numbers to settle. At each step record the requests per second the store actually answered, p95, the error rate, and CPU and database load from your monitoring, whether that is New Relic or the host’s dashboards. In k6, the ramping-arrival-rate executor steps the rate up on a schedule you set.
5. Find the step where response times bend
Capacity is the last step before p95 rises faster than the traffic, or before errors appear. Write it down in requests per second, and note what ran out first, CPU, PHP workers or the database, because that tells you whether the fix is more servers or cheaper requests. If the database ran out first, our guide to Magento MySQL optimization covers slow queries and indexes. Then compare the number with your real peak, and the gap between the two is what the next few weeks need to close.
6. Change one thing and run it again
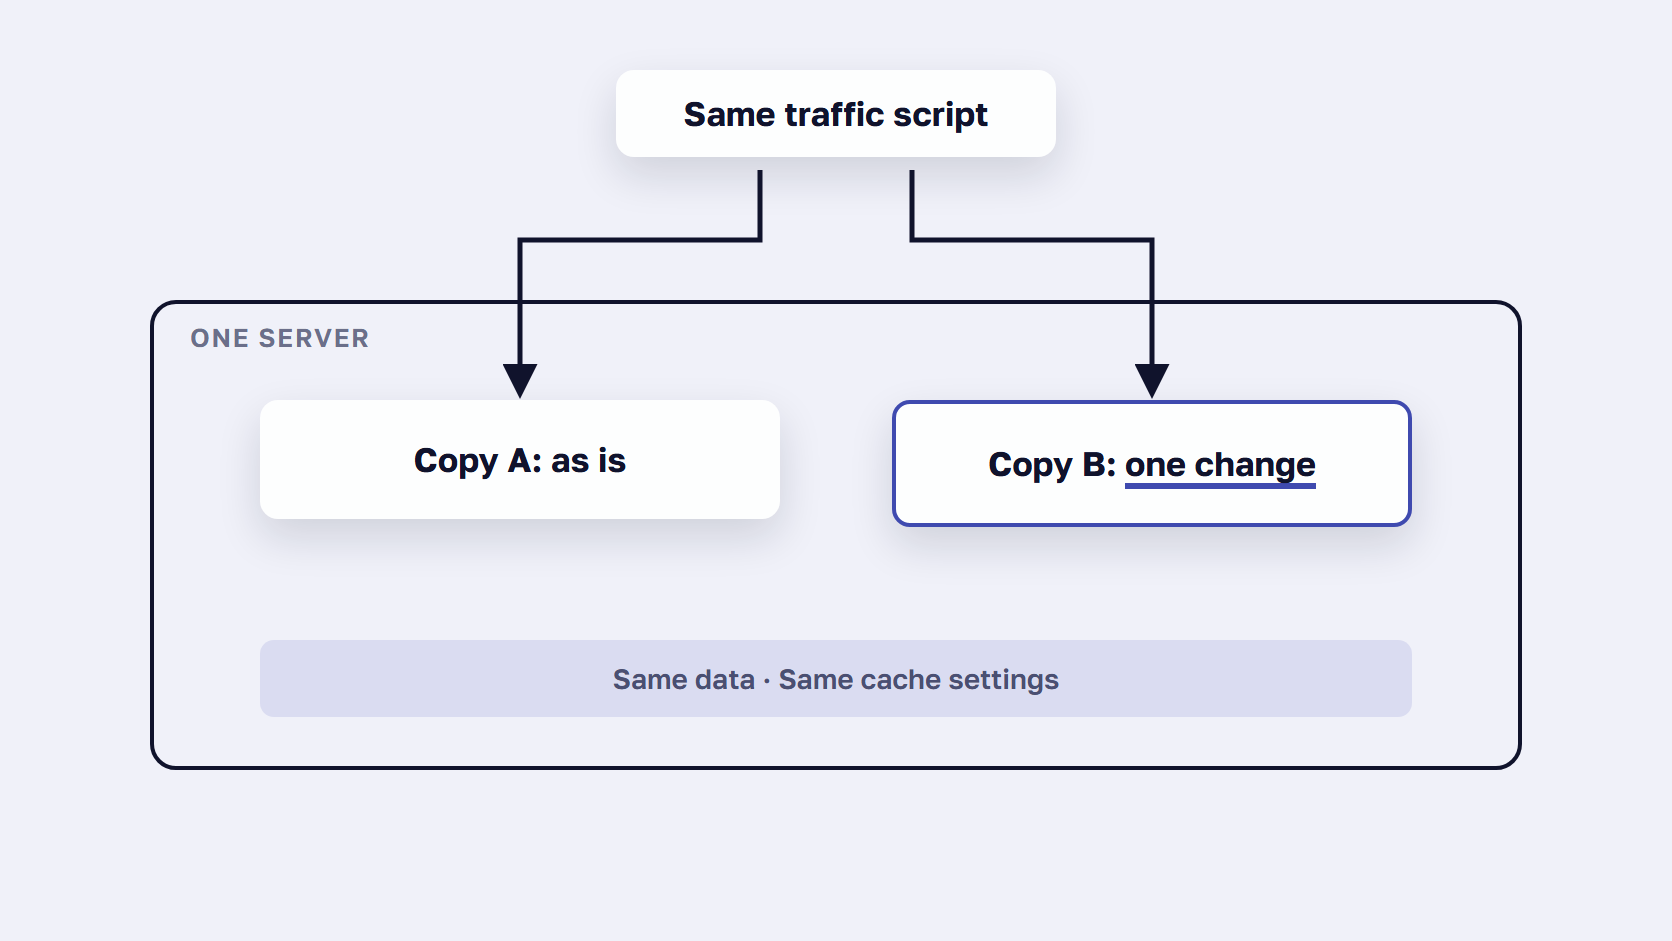
Same copy, same data, same script, same steps, and the cache reset the same way before each run. Repeat each step several times and compare the medians, so one noisy run can’t decide the result. One change per comparison: a PHP upgrade, a new server size or a module, never all three at once.
🚀 Quick takeaway
Change one thing between runs. If you upgrade PHP, add a server and switch on a cache in the same week, a better result can’t tell you which change made the difference.
What a fair load test looks like, with a worked example
A fair load test compares two versions of a store under identical conditions: the same server, the same data, the same cache settings and the same traffic, with one change between them. Repeating each run many times keeps one noisy result from deciding the outcome. Our Expedio benchmark followed that setup.
Expedio is scandiweb’s Magento module with an open-source core. It speeds up how Magento builds each page on the server by applying Liquid, the open-source template language created at Shopify, and makes that build at least 2x faster. It runs on Magento Open Source, Adobe Commerce and Commerce Cloud, with Luma, Hyvä or a custom theme, on any hosting, and leaves the theme, data, admin and checkout as they are.

To measure it, we ran the kind of fair test this guide describes. In a benchmark on one merchant’s Hyvä store, measured as server response time, two copies of the store ran side by side on one server, one as it runs today and one on Expedio, with the same data, the same hardware and no full-page cache on either, so Magento had to build every page. The test covered eight page types in 162 runs and 487,115 requests. Stock Magento’s category page climbed to 400 ms at 20 requests per second, the point where it began to struggle. With Expedio, the same server handles 3x the traffic before response times start to rise. The Expedio benchmark has the full method and its limits.
What to copy from it, whatever you are comparing:
- One round with the full page cache off, to see the build capacity rather than the cache’s.
- Page types tested one at a time as well as mixed, so one slow template can’t hide in an average.
- The benchmark’s own rule: “if an optimization would help both stores equally, we didn’t make it”. Every change in a comparison has to belong to the thing you are testing.
How to load test Adobe Commerce Cloud
On Adobe Commerce Cloud, open a support ticket before you load test, naming the environments, the tools and the time frame. Adobe’s testing guide covers load tests on Staging and Production before launch, and asks you to add results to the ticket and to note, with a date and time, when testing is complete.
Adobe’s Staging and Production testing guide lists the tools it expects: JMeter for spiked traffic such as flash sales, Siege, and New Relic, which comes with Cloud projects and finds the processes that slow down. It also asks you to review the Performance Toolkit before launch. The toolkit’s data generator works on Cloud projects, since Adobe marks it for on-premises and Cloud (PaaS) projects, and not for Adobe Commerce as a Cloud Service.
If your peak will run on a temporarily upsized cluster, book the upsize first and test at that size. Adobe’s temporary upsize request page says non-emergency requests need 48 business hours’ notice, and the Holiday Surge option is offered only from October to December. Adobe doesn’t connect the upsize to load testing. We do, because a test on the smaller cluster tells you about a server you won’t be running on peak day.
🚀 Quick takeaway
A temporary upsize on Adobe Commerce Cloud needs 48 business hours’ notice, and the Holiday Surge option is offered only from October to December. Book it before the load test, so you test at the size you will run at peak.
Frequently asked questions about Magento load testing
Is the Magento Performance Toolkit still part of Magento 2.4?
Partly. The setup/performance-toolkit folder still comes with Magento 2.4, and its five profiles still generate test data with bin/magento setup:performance:generate-fixtures. The JMeter load-test scripts that used to sit beside them, benchmark.jmx and benchmark_2015.jmx, were removed, and Magento 2.4.6 was the first release without them. Today you pair the toolkit’s data with a load-testing tool of your choice.
How long does it take to generate Performance Toolkit data?
It depends on the profile and the server. Adobe’s notes for the toolkit said the large profile, with 300,000 simple products, can take up to 4 hours to generate. To use fewer resources, run the generator with the -s option to skip indexing, then run bin/magento indexer:reindex when it finishes. Disable cron jobs before you start, as Adobe’s instructions require.
Which tool is best for Magento load testing?
The best tool is the one your developers can maintain. JMeter has the longest Magento history, since Adobe’s old toolkit scripts were JMeter files. k6 suits teams that write JavaScript and can hold a fixed rate of requests per second. Gatling suits Java teams, and Locust suits Python teams. All four are free and open source.
How many users should a Magento load test simulate?
Work from your own analytics. Take the traffic of your busiest past peak, express it as requests per second, and test past it in steps until response times rise. A user count on its own says little, because a simulated shopper who pauses between pages sends far fewer requests than one who doesn’t. The old toolkit’s default of 100 users was only a starting value.
What is the difference between load testing and stress testing?
A load test measures how fast the store responds under the traffic you expect. Adobe describes it as testing a number of concurrent users who each perform a set number of transactions in a set time. A stress test goes past that, to see whether the system still performs when the load goes well above the expected maximum. Run the load test first, then push on into a stress test.
Can you load test a store on Adobe Commerce Cloud?
Yes. Open a support ticket first, naming the environments you will test, the tools you will use and the time frame. Adobe’s testing guide covers load tests on Staging and Production before launch. Add your results to the ticket as you go, and when you finish, note in the ticket that testing is complete, with a date and time stamp.
Run your Magento load test before the next peak
Magento load testing answers one question before every peak: how much traffic your store takes before response times start to rise. The Performance Toolkit supplies the test data, a tool such as JMeter or k6 supplies the traffic, and a fair setup, one change at a time on the same server, makes the result something you can act on.
When the test shows a limit you need to raise, our guide on how to speed up Magento puts 15 fixes in order, from the server to the browser. Run the first test now, while there are still weeks to act on what it finds, and keep the script. The same test after each change is what turns a guess about capacity into a number you can plan a sale around.
If you want us to review your load-test setup or your results before the next peak, get in touch with our team.