
For the digital marketer, Google Analytics 4 (GA4) won’t be just a random conjunction of words that one hears for the first time—for it shook the Analytics community with its disrupting nature last year.
On the one hand, a lot of digital marketers quickly decided to get it on with the new tool. On the other hand, some have resisted jumping in right away. WHY? That’s the main question they’ve asked, too: Why should I bother investing my time and energy into learning something entirely new when I have my current analytics setup running just fine?
Let’s try to find the answer in this article together. We’ll talk about:
Google Analytics 4 in a Nutshell
What are the changes to Google Analytics? Before delving deeper into specific features that GA4 offers, it’s vital to point out the aspects that differentiate the various versions of Google Analytics.
At its core, the first distinguishing characteristic of GA4 lies in its data model, which is based entirely on events as opposed to pageviews batched into sessions—as is the case with its precursor, Universal Analytics (UA). GA4’s event-driven data model offers more flexibility when compared to previous Google Analytics iterations as it allows for a unified tracking system for web and applications while not being bound entirely to URLs. Although it may sound misleading, sessions and pageviews did not just miraculously disappear; they still exist but are registered as separate events.
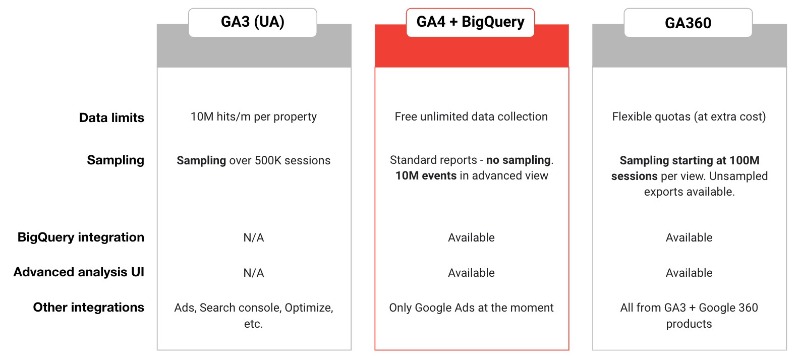
Another substantial distinction that deserves a spotlight is data collection and sampling thresholds. With Universal Analytics, there were certain limitations in terms of the amount of data that could be collected with the free version—10 million hits per property per month—which might not sound that great for traffic-heavy websites. GA4 eliminates this restriction by enabling free unlimited data collection, and, additionally, eradicating any possibility of sampling in standard reports.
An additional functionality related to data gathering that becomes quite handy when dealing with large data sets is BigQuery integration, which previously was available only in the paid version of Google Analytics (GA360). The underlying functionality grants access to your raw (complete) data with full ownership rights; meaning you can merge it with any sources (e.g., even your CRM platform that contains customer emails) to get a more holistic overview of the customer journey since it serves as a separate data warehouse.
Consequently, you can slice and dice it whichever way you wish—regressions, predictive analytics, etc. Nevertheless, be aware that data ingestion won’t happen retrospectively, so it would be wise to set it up as soon as possible.
GA4 vs Universal Analytics
The table below summarizes the differences between the three versions of Google Analytics we just discussed.
The last feature worthy of note in this section is reporting identity, which takes user identification to the next level by stitching your users’ behavior across platforms and devices. What ensues from this approach is a cohesive user journey that can be created using various methods that involve the user ID, Google Signals, and device ID.
Actually, you could already see individual user IDs in Universal Analytics, but they had their own separate entity—the user-ID view—which required one extra step to view and didn’t make it possible to analyze user-ID information along with other data without some extra data mapping.
Data Tracking
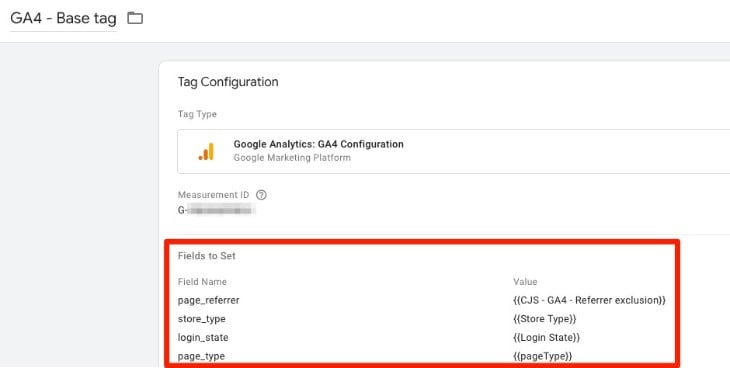
The next important topic we have to touch on is data tracking. The first milestone here is being able to create a data stream in the GA4 interface and then (if you are using Google Tag Manager for tracking purposes) set up the Configuration tag, which carries the Measurement ID (deploys the format G-XXXXXXX) of that particular data stream you just created. In a way, it incorporates the functionality of both the Google Settings variable and the Pageview tag with some additional capabilities.
Here’s what the Configuration tag does:
- initialize Google Analytics for your property
- set Google Analytics cookies
- send automatic events (e.g., first visit, pageview, session start)
- send enhanced measurement events that you can enable and configure in your Google Analytics 4 interface within the data stream (e.g., scroll, outbound clicks)

Furthermore, the configuration tag is the place to define certain custom dimensions, which you would want to pass along with all hits, say the user’s login status.
Apart from the basic data collection, you are likely to be wondering about how to set up additional events that would apply to your business in particular. Prior to devising your own events, though, check Google’s recommended events list first. The events you’ll find on that list (e.g., search and login) already come with relevant parameters. Their implementation will enable you to have more detailed reports and make the most of the latest GA4 features.
Now, event parameters effectively substitute some of the event components from previous Google Analytics versions. You don’t have to be tied to an event category, label, or action anymore; no longer is there a need to memorize indexes for custom metrics and dimensions either, because you are offered the opportunity to define your own descriptive naming, which you can use both in the configuration tag and the event tag.
Just don’t forget to register your newly implemented event parameter in the interface, or you won’t be able to make use of it in reports. And remember the event parameter limitations—a maximum of 50 custom dimensions and 50 custom metrics per property.
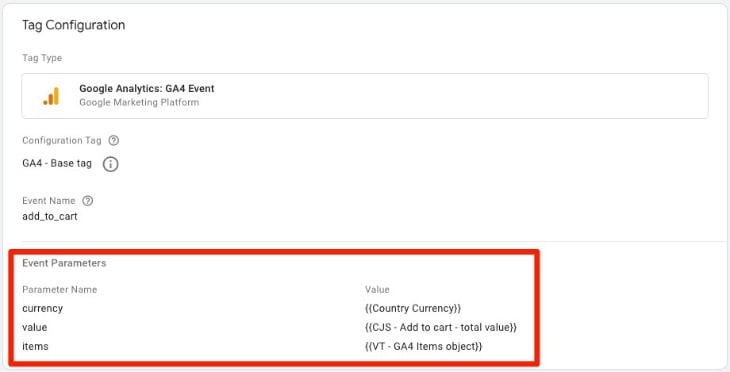
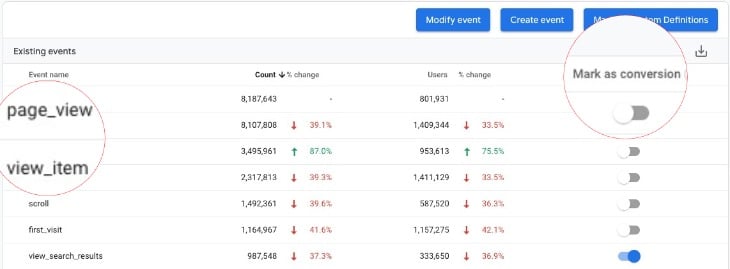
After you’ve ascertained that none of the automatic events, enhanced measurements, or recommended events can fully satisfy your needs, it’s time to implement custom events. They are not as rigid as predetermined ones and grant more versatility and room for expression in terms of naming both events and parameters. It is possible to create an event not only in the Google Tag Manager but also in the GA4 interface, where you can incorporate existing events based on the combination of event parameters that you deem useful, e.g., by considering the URL where an event occurs.
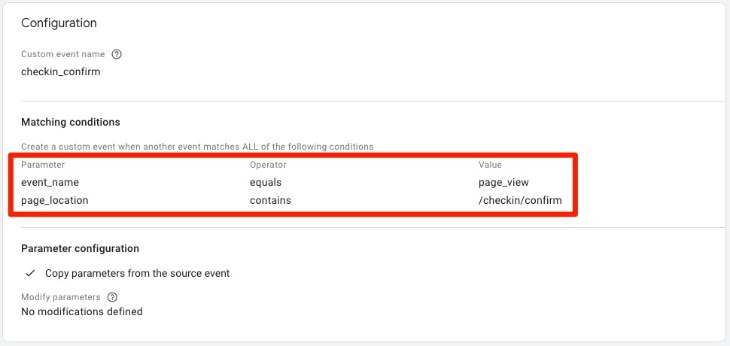
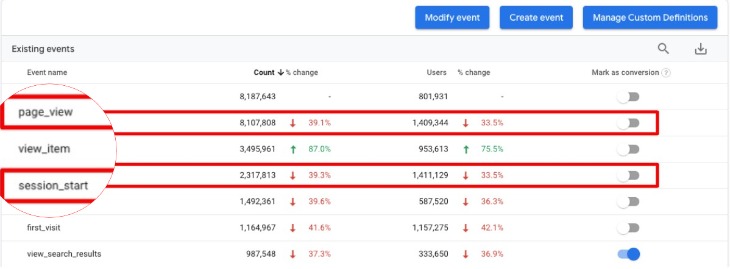
Another useful update in GA4 can be seen in the goal creation process. It is now simplified and allows for marking an existing event as a conversion right in the events list—crucial for distinguishing truly valuable events from the rest.
Standard Reporting
Once you’ve verified that your tracking is configured correctly and you see data flowing into your property, Google Analytics 4 reporting capabilities can be used to make sense of the gathered data. One way to get there is by accessing standard reports. They provide some out-of-the-box figures and grant you an overview of your data in a more visually appealing manner than its forerunner.
There are several bigger blocks of reports that
you should familiarize yourself with:
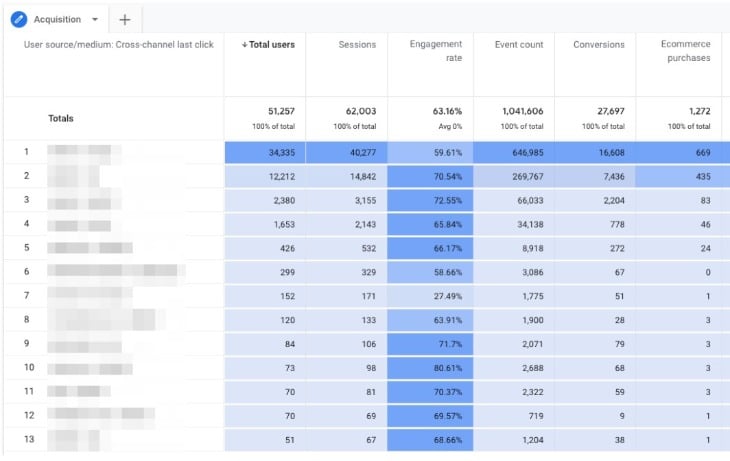
- Acquisition
- Engagement
- Monetization
- Demographics
- Tech
Their naming is rather self-explanatory and
intuitive. For instance, the Acquisition report deals with the user acquisition
channels while the Engagement report represents user engagement.
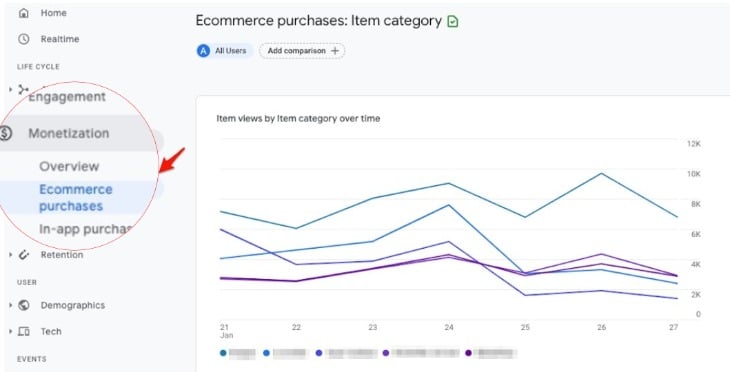
For an eCommerce business, Monetization is the section to view to assess how the company is performing financially on a more granular level, as the refined visualization options allow for a broader data perspective and analysis. For example, you can see how various product categories perform in relation to each other and over time, in the eCommerce purchases report, which is a handy way to spot common trends and unravel significant differences at just one glance at the graphs.
Another aspect that is definitely worth highlighting is sampling in standard reports, namely, its absence. The newest GA version ensures that no sampling takes place; the presence of sampling is considered a weak point that would impair your conclusions and weaken the reliability of data.
It is always accentuated that what truly differentiates the beginner Google Analytics user from a more advanced one is the practice of using segments and secondary dimensions, which is how key insights are brought to the foreground. The catch, though, is that applying these to the data increases the probability of working with incomplete data.
Fortunately, this issue ceases to exist in GA4 where you can choose secondary dimensions, apply your audiences, and even create a comparison segment right in the report UI—which would persist for all the other reports, too, including the Realtime report.
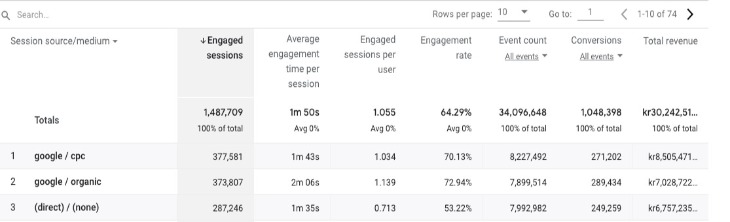
One peculiarity that you will notice pretty soon if you haven’t already is the missing bounce rate metric. Unlike sessions and pageviews that carried on their existence to GA4, bounce rates have completely left the scene. You won’t find bounce rates even in your own individually designed custom reports. What you will encounter, instead, is a set of engagement metrics.
Engagement metrics maintain the primary purpose of bounce rates—gauging the number of sessions with a certain degree of interactivity with the content present on your website. As the name suggests, engagement rate is the opposite of bounce rate, i.e., if your target bounce rate was set at a mark of 60%, the corresponding engagement rate value would be 40%.
However, like most aspects related to GA4, it is not exactly straightforward because engagement metrics extend the entire concept of interactivity. Specifically, a session will be counted as an engaged one if a user fulfills at least one of the following:
- Actively engage with your website
or app in the foreground for at least 10 seconds - Fire a conversion event
- Fire at least 2 screens or
pageviews
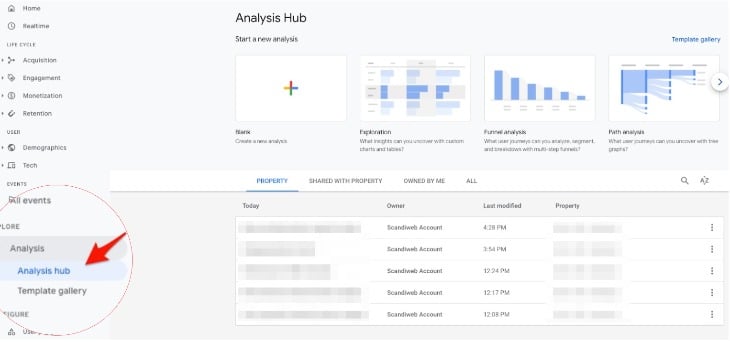
Analysis Hub
Once you get accustomed to the readily available Google Analytics 4 features and reports—those accessible without any additional input from your side—you may start wondering what else is there that could boost data exploration, assessment, and decision-making processes. This is where the Analysis Hub steps into play. This section delivers significant improvements compared to prior GA versions, thanks to the versatile visualization and data segmentation options it offers.
Let’s break down the report types that you can leverage for different kinds of analyses:
1. Funnel analysis
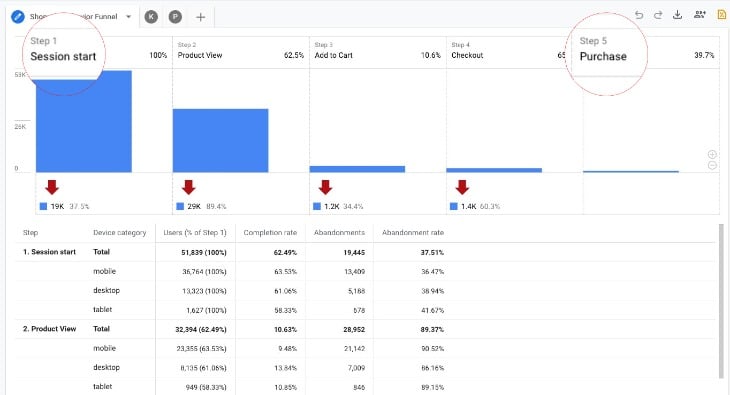
Although funnel reports already exist in Universal Analytics, GA4 offers more elaborated funnel customization capabilities that enable you to define and adjust steps on the fly. Now you can set up either closed or open funnels (where users can enter at any step); access trended funnels to examine trends over time, enabling you to spot anomalies in the defined step dynamics; and see the elapsed time between each of the steps to evaluate how long it takes to complete the entire user journey and where the biggest delay occurs.
As a case in point, below you can see the shopping behavior funnel report that depicts how users proceed throughout the conversion funnel, split by device type with a user-based conversion rate.
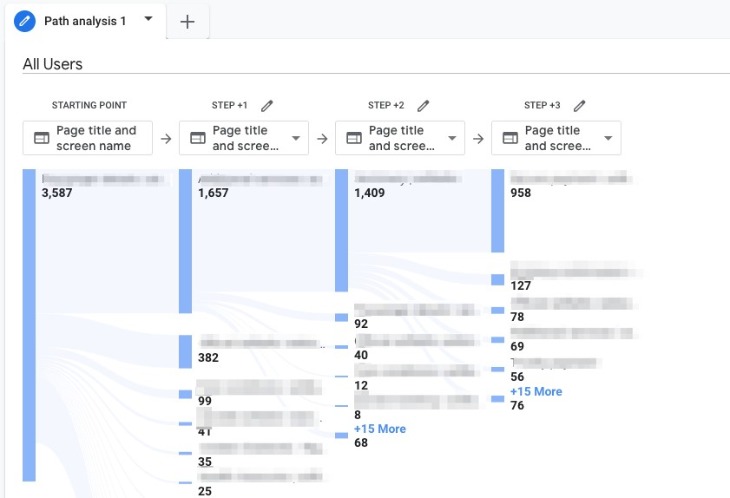
2. Path analysis
Path analysis lets you discover the most common path users take from a starting point to an ending point, which you can freely specify. For example, a starting or ending point can be a particular page (e.g., a thank-you page) or an event, say a conversion or any meaningful action (e.g., newsletter subscription). This report certainly shines when contrasted against the one available in GA3 due to its accessibility and ease of use.
3. Exploration report
If performing data analysis comprises some part of your work, you will know that heat maps are a great way to contrast performance metrics split by dimensions. Instead of looking at a flat table, you can utilize this functionality within the GA interface without any extra data exports to Google Spreadsheets.
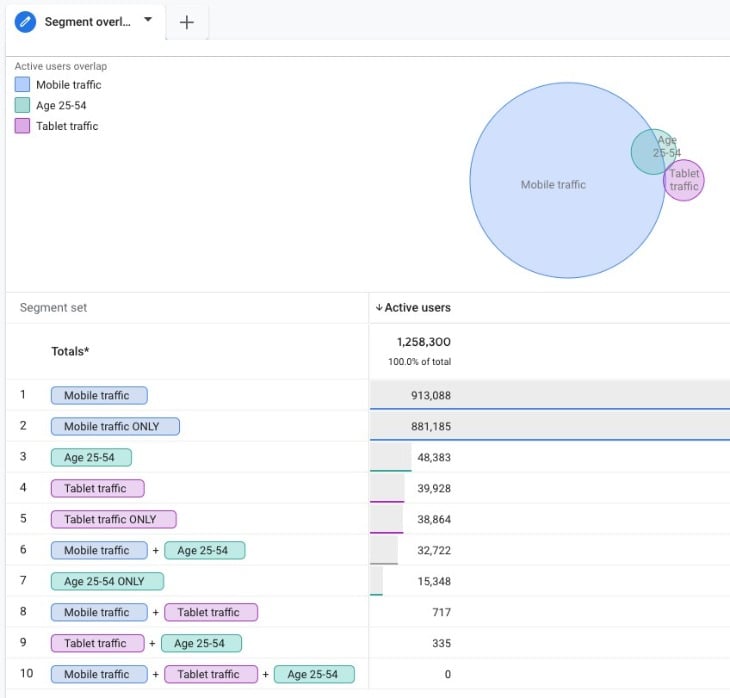
4. Segment overlap
Ever wondered how your created segments are interrelated? This report type gives you an explicit answer by revealing the relationship between the different segments that you have. You can instantly discern which ones might be mutually exclusive and which ones have considerable overlap, along with some quantifiable information like user count.
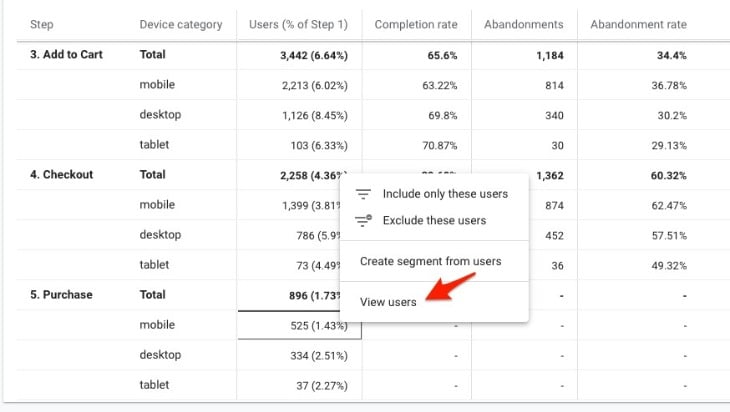
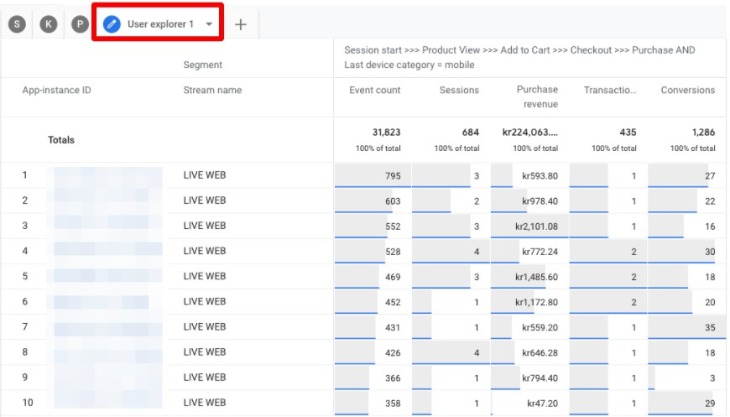
5. User explorer report
Finally, the last report we will touch upon here is the User explorer report where you can see data entries per individual user, similar to the approach used in Universal Analytics. Then again, there is a bonus component incorporated in custom reports that allows you to view a fraction of users that you are most interested in.
You can access this from any report by right-clicking on the user segment you would like to explore and then selecting “View users.” You can take advantage of this report if you want to get rid of all the “noise” in your data.
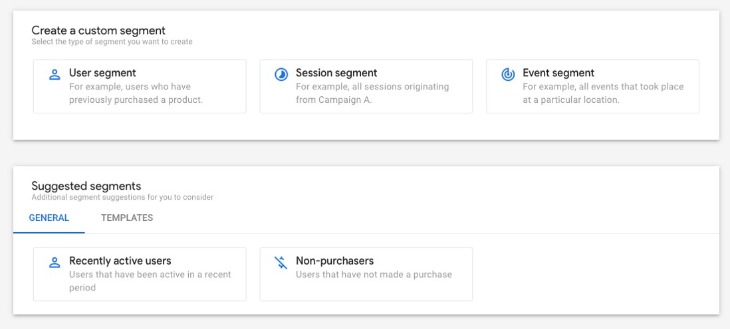
Segments & Audiences
The ultimate point that I would like to put a special emphasis on are audiences. Essentially, they serve the same purpose as segments—splitting users into groups that meet certain criteria, such as gender, device, and geolocation, to look for patterns common for a particular subset of users. However, there are key differences that add noteworthy value to the most recent version of segments. Let’s walk through a couple of those.
First, there is the new events-based segment, which is not present in Universal Analytics. In Google Analytics 4, segments can be created based on users, sessions, or events.
Second, you can generate segments from the segment suggestion list. Generated segments will already have some predefined fields set up to aid you in the process.
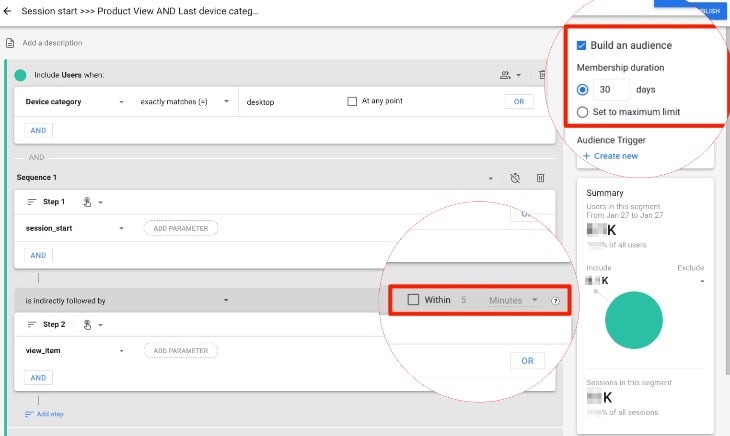
Third, there is the possibility to embed the concept of time into your segment, which is something entirely new. For instance, when setting up the sequence for a segment, you can add elapsed time between steps and/or user membership duration as factors. This feature can be quite handy for your remarketing campaigns.
Moreover, you can exclude users either temporarily or permanently, which even further removes the constraints from the created segments.
Fourth, you can publish an audience that will unfold more segment application possibilities. For one, you’ll have the opportunity to utilize them in the core reports. But more than that, you can grant immediate access to your audience in Google Ads. By default, all published audiences will be shared with Google Ads unless you opt out. In contrast, you’ll need to publish your audiences individually in Universal Analytics.
And finally, you can make use of the audience trigger to create an event (and afterward even a conversion) when a user becomes a member of an audience.
Upgrading to Google Analytics 4
As a final note, it should be clarified that it’s definitely possible to add a GA4 property to a site that already has Analytics. Google has easy step-by-step instructions on how to do that.
Google Analytics 4 vs Universal Analytics: Which is better?
What I have laid down for you here is not an exhaustive list of all the functionalities the successor of Universal Analytics has in its arsenal. Google Analytics 4 brings with it a vast spectrum of new and enhanced components waiting to be discovered and utilized. That said, more enriching capabilities are yet to come. And given the pace at which GA4 evolved into how it is now, it won’t be a long wait until we see more of them coming.
So take heed: now is the best time to jump onto the Google Analytics 4 ship if data drives your decision-making and you want to start harnessing the benefits of GA4 for your business.
But don’t get the wrong idea—this is not to say that you should delete your current Google Analytics property altogether and start building everything from the ground up in GA4. What you could do is set up parallel tracking and gather some data to work with while still learning. This way, you can hone your GA4 skills and familiarize yourself with how differently or similarly the two versions work.
And that’s it. Good luck with your GA4 exploration journey!
Need expert advice on how to make your business decision-making more data-driven? Or need support in your Google Analytics 4 setup? Get in touch with our Analytics team and get a digital analytics health check as a first step!

Share on: