
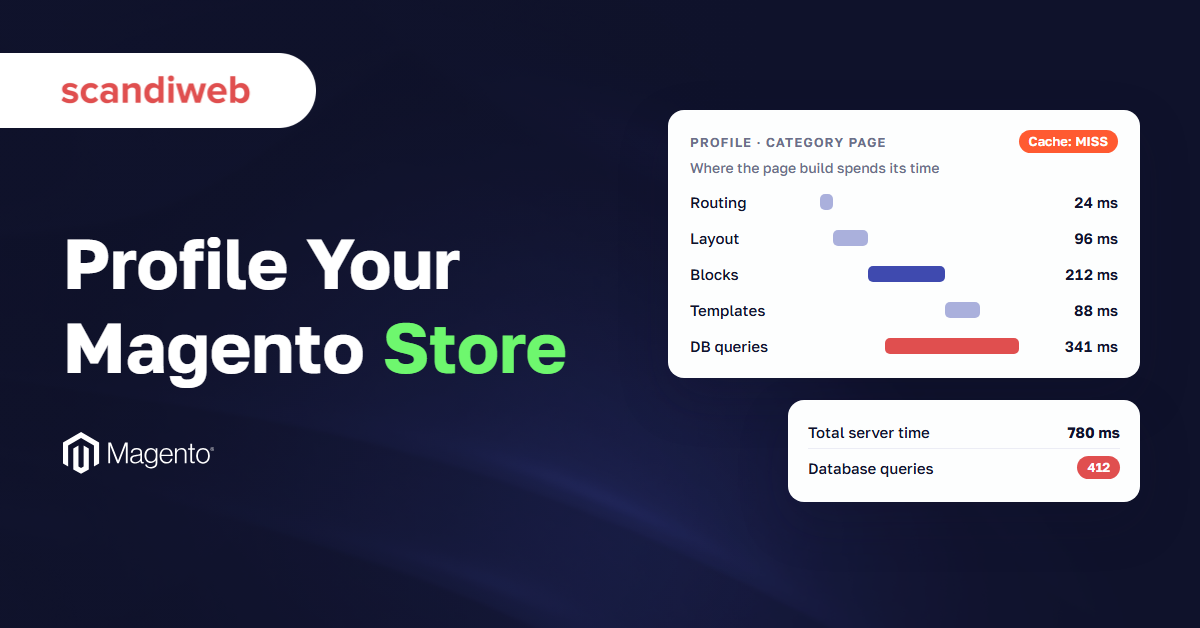
When a Magento (Adobe Commerce) store slows down, the conversation about it tends to follow a script: the host blames the code, the developers blame the server, and someone asks whether clearing the cache would help. All three are guesses, because nobody in that conversation can see what Magento does while it builds a page.
A Magento profiler lets you see it. It’s a tool that times each step Magento takes to build one page and shows which steps used the time. Magento comes with a basic one. New Relic, a monitoring service that records timings from every request on a live store, and Blackfire, a profiler you aim at one request at a time, go further. Which tool you pick, and which page you point it at, decides whether the result names a real culprit or sends you after the wrong one.
What is a Magento profiler?
A Magento profiler is a tool that times each step Magento takes to build a page: matching the URL to a controller, loading the layout, rendering blocks and templates, running extension code and querying the database. It lists every step with its time and how often it ran, so you can see where one page spends its time.
Two kinds of tool do this. Magento’s own profiler, Blackfire and Xdebug time one request in detail. New Relic, an APM (application performance monitoring), watches every request on the live store. They answer different questions.
What a profile of one page shows
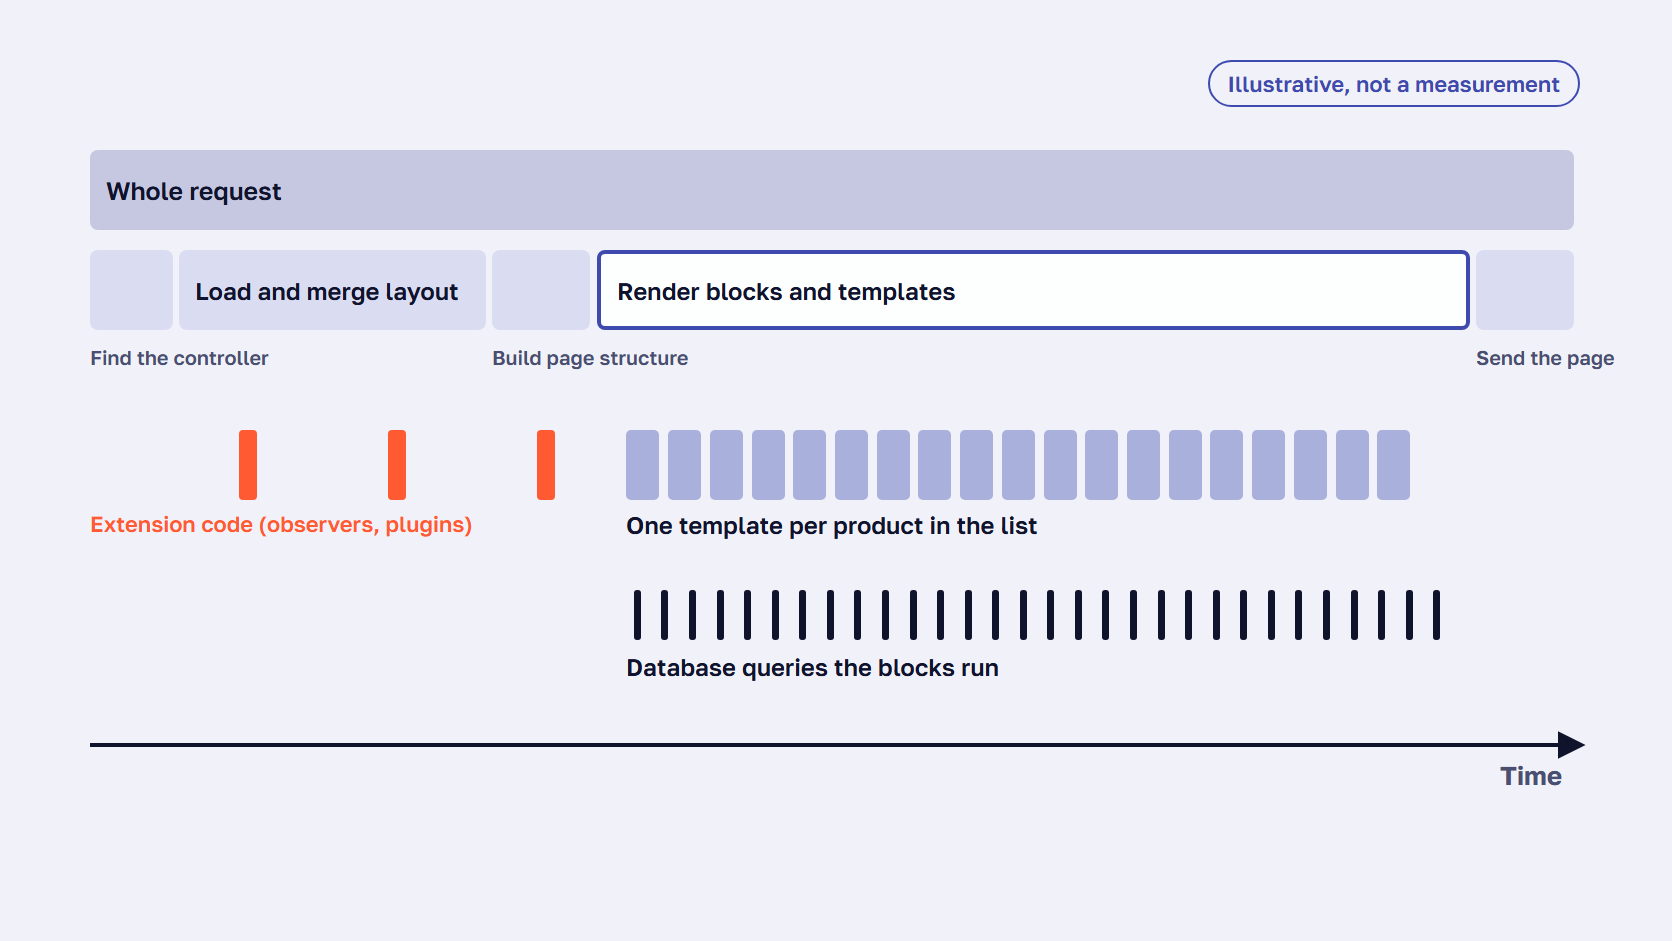
Take one page Magento has to build from scratch. It finds the controller for the URL (routers_match), loads and merges the layout, the XML instructions that say which blocks go on the page (LAYOUT), and builds the page structure (generate_elements). A block is one piece of the page, such as a product list, and its template is the file that turns the block’s data into HTML. Each template is rendered in turn (TEMPLATE: plus the file name). Along the way, Magento runs observers, extension code that responds to its events (OBSERVER:), and plugins, extension code wrapped around one of its own functions.
Each block’s data comes from the database, so a block that runs once per product multiplies its queries. Magento’s own profiler has no timers for plugins or single queries. New Relic and Blackfire show both.
Profile a page the cache doesn’t serve
Most stores run a full page cache, usually Varnish, a cache that keeps finished pages and sends them without asking Magento to build them again. A page served from Varnish never reaches Magento, so there is nothing to profile. Logged-in, filtered and search pages are cached too, per customer group and per search term. They just miss more often, which is why shoppers feel them. For what the cache keeps and when it misses, read how Magento’s full page cache works.
On a staging copy (a copy of the store for testing, with production data and settings), switch the page cache off with bin/magento cache:disable full_page so Magento builds every page, and turn it back on with cache:enable full_page afterwards. With html output, the profiler table appears only on a page Magento built, so no table means the page came from a cache.
To see which page types are slow before you profile, time them from the cache and uncached, as our guide on how to audit Magento performance shows.
🚀 Quick takeaway
Profile a page your shoppers actually wait for. A page served from Varnish never reaches Magento, so there is nothing to profile. Logged-in, filtered and search pages miss the cache far more often, so start there.
How to enable the Magento 2 profiler
To enable the Magento 2 profiler:
- Use a staging or local copy.
- In the Magento root, run
bin/magento dev:profiler:enable html(orcsvfile). - Load the page you want to measure.
- Read the table at the bottom of the page, or
var/log/profiler.csv. - Run
bin/magento dev:profiler:disablewhen done.
# Magento root, staging or local copy, as the file system owner
bin/magento dev:profiler:enable html      # table printed below each page Magento builds
bin/magento dev:profiler:enable csvfile   # or: timings written to var/log/profiler.csv
bin/magento dev:profiler:disable          # removes var/profiler.flag
The command writes var/profiler.flag with the output type, and disabling deletes it. The MAGE_PROFILER bootstrap variable does the same job, set as Adobe’s profiling page describes. Set to 2, it also prints dependency graphs, which list objects Magento created but never used.
One warning from the code: Magento checks only that the flag exists and that the request asks for an HTML page. It doesn’t check the store’s mode, so on a live server every page Magento builds would carry the table, and the CSV would hold whichever request ran last. Staging or a local copy only, and disable it when you finish. Because of that HTML check, the profiler times browser page loads only. API and AJAX calls need New Relic or Blackfire.
How to read the profiler table
The caption shows the memory the request used. Under it, there is one row per timer: Time in seconds, Avg, Cnt (how many times it ran), Emalloc and RealMem (memory). Nested timers are indented under their parent, so start from magento, the whole request, and follow the biggest child down. Read Cnt next to Time: a template rendered once per product in a list shows a high count. To compare two runs, open two csvfile outputs in a spreadsheet.
Count queries with the database profiler
Magento’s database profiler lists every query a page sends, with its time and parameters, and the total count. It is switched on in app/etc/env.php, Magento’s main settings file for the server.
// app/etc/env.php, inside 'db' => ['connection' => ['default' => [ ... ]]]
'profiler' => [
    'class' => '\Magento\Framework\DB\Profiler',
    'enabled' => true,
],
Adobe’s database profiler page has the short snippet that prints the result, which goes into pub/index.php after the $bootstrap->run($app) line. It prints the queries into the page, so staging only, and remove both when you finish. Read the total count first, then look for queries that repeat with only the ID changing, which points to a block or plugin that loads data one item at a time. When a few queries are slow rather than many being quick, the next step is the MySQL slow query log, covered in our guide to Magento MySQL optimization.
🚀 Quick takeaway
The CSV output in var/log/profiler.csv is overwritten on every page load. Copy the file after each run and name the copy after the page and the change you tested, so you can compare a before and an after.
Magento 2 New Relic integration
Magento 2 connects to New Relic through New Relic’s PHP agent, which runs inside PHP on the web server and sends timing data for every request to your New Relic account. New Relic lists Magento 2 among the frameworks the agent supports. On Adobe Commerce Cloud, New Relic APM is already included for Production and Staging.
The PHP agent is a PHP add-on that sends timing data to New Relic. There, requests are grouped into transactions, such as category or product views, ranked by the time they take, with code-level and database query traces for individual requests. This is Magento performance monitoring, and it runs all the time on the live store.
New Relic on Adobe Commerce Cloud
Every Adobe Commerce on cloud infrastructure project includes New Relic APM, on Pro and Starter, for Production and Staging, with the software and the license key. There is nothing to buy or install. Pro adds New Relic Infrastructure and Log Management. Two limits, from Adobe’s New Relic service page: other New Relic features aren’t available, and you can’t send data from servers outside the project. Read “Most time consuming” in the APM summary first. In Adobe’s example, product and category views sit at the top, and a customer account page that suddenly ranks high has a call or a query dragging it down.
New Relic on your own servers
Install New Relic’s PHP agent on each web server: the agent runs inside PHP and records timings, and a daemon forwards the data to New Relic. New Relic lists Magento 2 as a supported framework on its PHP agent compatibility page. Check the agent version after a PHP upgrade: PHP 8.5, which Magento 2.4.9 runs on, needs agent 12.4.0.29 or later. For the PHP version of each release, see the Magento 2 system requirements. Keep New Relic running during a Magento load test, so you can see which requests slow down first as traffic climbs.
The New Relic Reporting module in Magento 2
Magento includes a module called New Relic Reporting, and it isn’t the profiler. The timing data still comes from the PHP agent, and the module needs that agent installed to do anything. What it adds is store events in your New Relic account: deployments, cache flushes, product saves, orders, and logged-in admins and customers. The settings are under Stores > Settings > Configuration > General > New Relic Reporting, and on 2.4.9 you can choose the newer NerdGraph API for deployment markers. Marking a release is optional:
# Needs the New Relic Reporting settings filled in
bin/magento newrelic:create:deploy-marker "Release 2026-11-04" "Checkout fixes" "deploy-bot"
Adobe removed the module’s documentation in September 2025 and calls the feature deprecated, though the module still comes with 2.4.9, in the module’s folder on GitHub.
🚀 Quick takeaway
Before you buy a monitoring tool for a store on Adobe Commerce Cloud, open the New Relic account that came with the project. APM is included on Pro and Starter for Production and Staging.
Blackfire and Xdebug: profile one request in depth
Blackfire is a PHP profiler that records one request in full: each function call, the time it took and what called it, shown as a call graph and a timeline. Its maker says profiling HTTP requests has no impact for other visitors. Xdebug’s profiler gives similar detail on a developer’s own copy of the store.
A call graph is a map of which function called which, with the time each took.
Blackfire on Adobe Commerce Cloud and other hosting
You start a Blackfire profile of one request from the browser or the command line. Blackfire records the calls per function, which function called which, wall time and I/O time, as a call graph or a timeline. Blackfire says Magento stores can be profiled on demand in production, staging, integration and development, and on premise an optional Magento add-on gives Magento-specific recommendations, per Blackfire’s Magento page.
On Adobe Commerce Cloud, Adobe stopped including free Blackfire access on April 11, 2020, for Pro and Starter, so you buy a license from Blackfire. Its Cloud guide notes that the Fastly bypass it needs is set by default there. Plans are called Development and Production, with no free trial.
Xdebug for profiling on a developer’s machine
Xdebug is a PHP extension developers use for debugging and profiling. Three settings turn its profiler on:
; php.ini or 99-xdebug.ini on a developer's machine
xdebug.mode = profile
xdebug.start_with_request = trigger   ; only requests that carry XDEBUG_TRIGGER
xdebug.output_dir = /tmp              ; the default, files named cachegrind.out.<process ID>
Xdebug writes one Cachegrind file per profiled process, named cachegrind.out. plus the process ID, in /tmp by default and compressed. Open it in KCacheGrind, in QCacheGrind on Windows (turn compression off with xdebug.use_compression) or in PhpStorm, as the Xdebug profiler docs describe. Trigger mode limits profiling to the requests you choose. Keep Xdebug on a developer’s own copy.
🚀 Quick takeaway
Set xdebug.start_with_request to trigger, so Xdebug profiles only the requests you mark with XDEBUG_TRIGGER. Xdebug’s manual warns that profiles of complex scripts can be enormous, and a Magento page is one.
Which Magento profiling tool should you use?
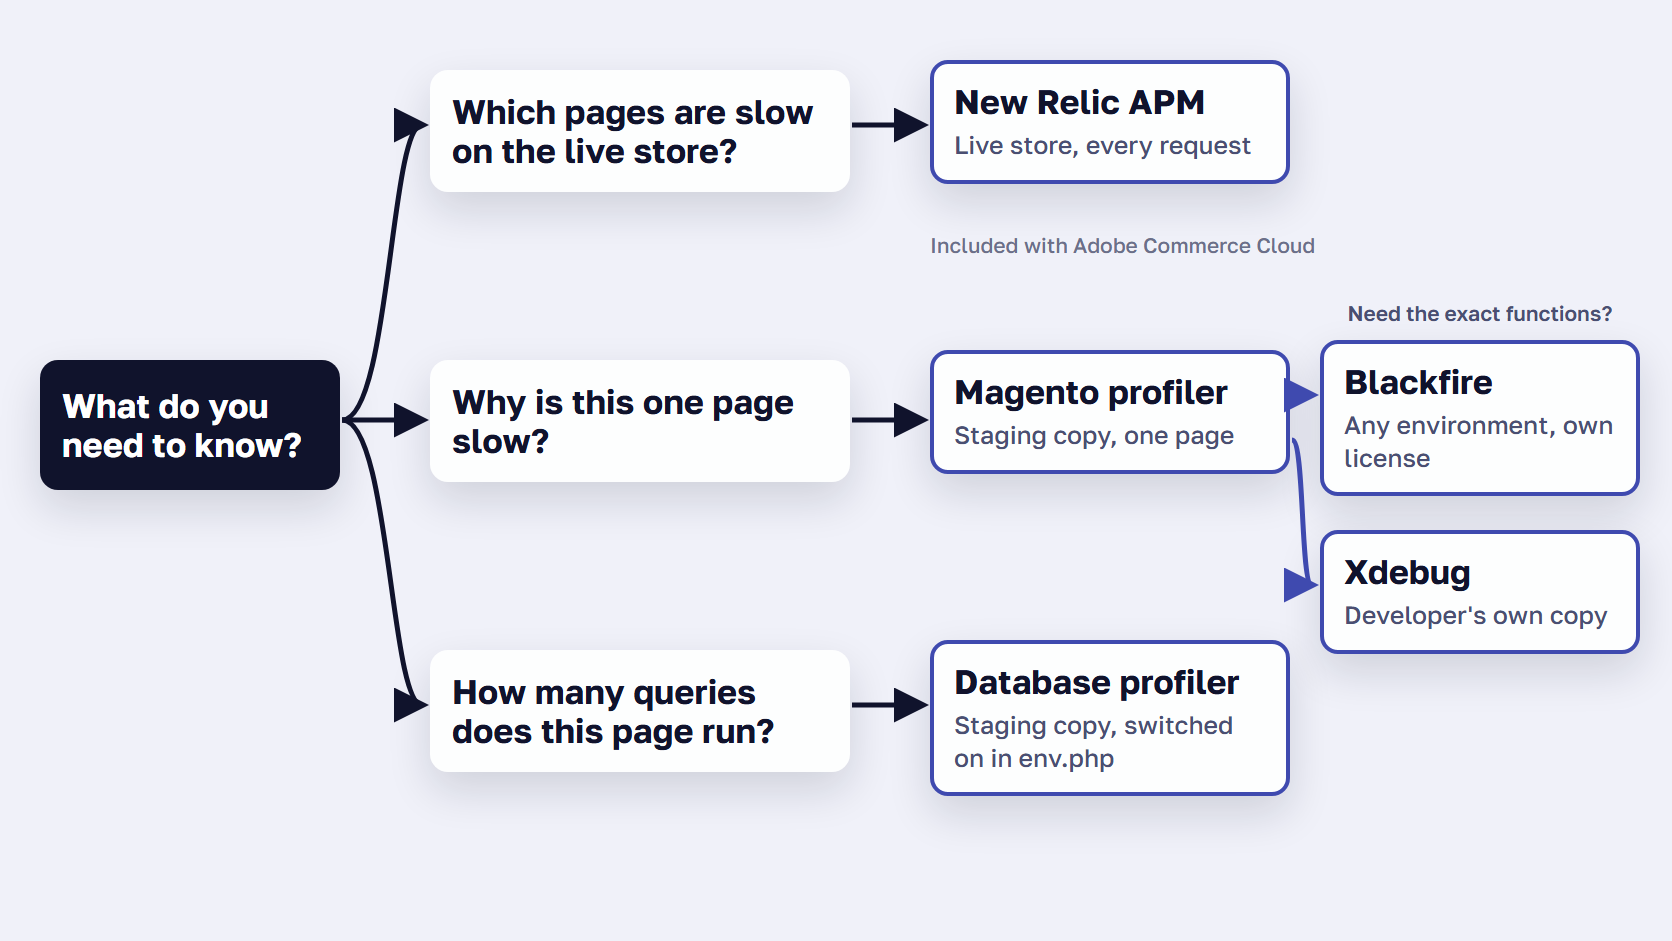
Use New Relic to find which pages and requests are slow on the live store, over days of real traffic. Use Magento’s built-in profiler on staging for a quick breakdown of one page, and its database profiler to count that page’s queries. Use Blackfire or Xdebug when you need the exact functions that make one request slow.
If you haven’t narrowed the slowness to the page build yet, start with why a Magento site gets slow.
| Tool | Question it answers | Where to run it | Where it comes from |
|---|---|---|---|
| Magento profiler | Which steps of one page build take the time | Staging or a local copy | Built into Magento |
| Database profiler | How many queries one page sends, and how long each takes | Staging or a local copy | Built into Magento, switched on in env.php |
| New Relic APM | Which pages and requests are slow on the live store, and when | Production and staging | Included on Adobe Commerce Cloud. Elsewhere, a free tier or a paid edition |
| Blackfire | Which functions make one request slow | Any environment, on demand | A Blackfire license (Development or Production plan) |
| Xdebug | The same, on one developer’s machine | A developer’s own copy | A PHP extension the developer installs |
Most teams use two, New Relic to find the slow page on the live store and a profiler to explain it on staging.
What to fix once the profile points somewhere
Fix the step that takes the most time, then profile the same page again under the same conditions. In the Magento profiles our developers read, the time usually goes to extension code that runs on every request, blocks that load data once per product, or a page build that sends hundreds of database queries.
Extension code on every request shows up as an observer or a plugin high in the list. Disable it on staging and profile again. If the time drops, remove, replace or fix it. If the slow step is your own code, a Magento code audit reviews it with security and code quality.
A block that loads data once per product shows as a template or a query with a high count. Load the data once for the whole list, or cache the block’s output if it is the same for every shopper.
Sometimes the profile names no culprit. The time is spread across layout, blocks and hundreds of small queries, and the cost is how Magento builds the page itself.
For that pattern there’s Expedio, scandiweb’s software for Magento, with an open-source core. It changes how Magento builds each page on the server, using Liquid, the open-source template language Shopify created, and the build runs at least 2x faster. Expedio works with Magento Open Source, Adobe Commerce and Commerce Cloud, on Luma, Hyvä or custom themes and any hosting, and your theme, catalog, prices, admin and checkout stay as they are. On the same server, it handles 3x the traffic before response times start to rise.

Our CTO put it this way after measuring stock Magento: most of the time goes into building the page itself, “and much of that is spent fetching data piece by piece.” In a benchmark on one merchant’s Hyvä store, measured as server response time, stock Magento ran 604 database queries to build the homepage and 655 for a full category page, with no full page cache on either copy. With Expedio, the same pages ran 11 and 30. The Expedio benchmark covers the method and its limits.
🚀 Quick takeaway
In the profiler table, read the Cnt column as well as Time. A step that is quick once but runs for every product in a category list can cost more than one slow step. The fix is to load that data once for the whole list.
Frequently asked questions about the Magento profiler
Can you run the Magento profiler on a live store?
Not safely. The built-in profiler switches on through a flag file, var/profiler.flag, that covers every browser page request on that server in any mode. In HTML mode, every page Magento builds would carry the timing table, and the CSV file keeps only whichever request ran last. Profile on a staging copy with production data and settings. On the live store, use an APM such as New Relic.
Where does the Magento 2 profiler output go?
With the html type, Magento prints the profiler table when the request ends, below the page it built, so you scroll to the bottom to read it. With csvfile, it writes var/log/profiler.csv in the Magento root, and Adobe notes the file is overwritten on each page refresh. Dependency graphs, turned on with MAGE_PROFILER set to 2, also show at the bottom of the page.
Is New Relic included with Adobe Commerce Cloud?
Yes. Every Adobe Commerce on cloud infrastructure project includes New Relic APM, on Pro and Starter plans, for the Production and Staging environments, with the software and license key provided. Pro projects also get New Relic Infrastructure and Log Management. Adobe notes that other New Relic features aren’t available and that you can’t send data from servers outside the Cloud project.
Is profiling the same as Magento performance monitoring?
No. Performance monitoring watches the live store all the time and shows which pages, requests or servers are slow, and when. Profiling takes one request and breaks it into the steps and functions that used its time. A monitoring tool such as New Relic tells you where to look, and a profiler shows why that request is slow.
Is Blackfire still included with Adobe Commerce Cloud?
No. Adobe stopped including free Blackfire access in Adobe Commerce on cloud infrastructure Pro and Starter subscriptions on April 11, 2020. You can still use Blackfire on a Cloud project by buying a license from Blackfire directly and following its setup guide for Adobe Commerce Cloud. Blackfire sells Development and Production plans and doesn’t offer a free trial.
Does New Relic have a free plan for Magento stores?
Yes. New Relic’s free tier includes 100 GB of data ingest a month and one full platform user, with no credit card required. If a month’s data goes over 100 GB, ingest stops until you upgrade or the next month starts. Paid editions are Standard, Pro and Enterprise. On Adobe Commerce Cloud you don’t need it, because New Relic APM comes with the project.
Where to start with the Magento profiler
Start with the Magento profiler on a staging copy, aimed at one page your shoppers wait for, with the cache out of the way. If you first need to know which pages are slow on the live store, New Relic answers that, and Blackfire or Xdebug take you down to the function that costs the time.
Once a profile has put the problem on the server, our guide to speed up Magento lists the other fixes in order, from hosting to the browser. If you’d like someone to read the profile with you, our Magento performance audit profiles your custom code and slow queries and returns a prioritized report.
Not sure which page to profile first? Tell us which pages feel slow and we'll help you pick one.