FREE TOOL
eCommerce conversion rate calculator
Enter three numbers and see how your store compares to others in your industry. You get your position in the range, from the bottom quartile to the top 10%, and what the gap is worth in revenue every year.
Trusted by 700+ leading brands worldwide


Trusted by 700+ leading brands worldwide
Benchmark your conversion rate against your industry
Want the diagnosis behind the number?
scandiweb runs CRO programs for Puma, Jaguar Land Rover, and BMW. Send us your store URL and we will send back a prioritized list of what is costing you conversions, what is causing it, and what each fix is worth. Free.

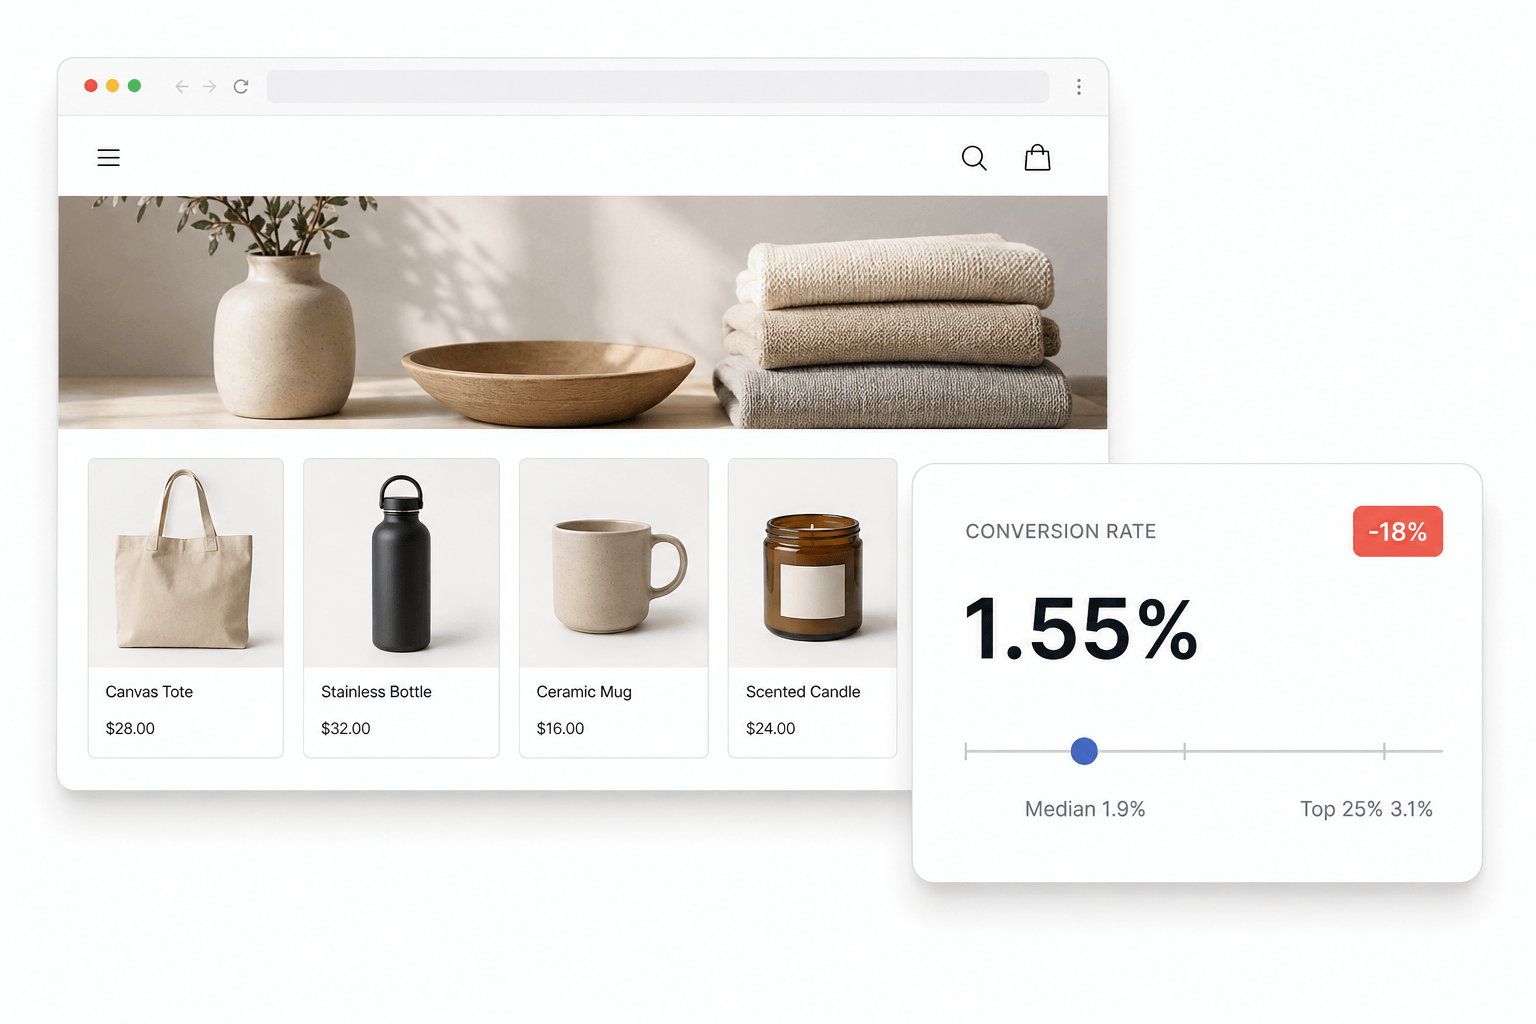
What is a good eCommerce conversion rate?
Most sources quote 1.8% to 2.5%. That average is real, but it makes a poor target. What counts as good depends on what you sell. Food and beverage stores convert at a median of 3.6%. Furniture retailers convert at 1.2%. Neither is doing better than the other.
Compare yourself to stores that sell what you sell. A 2.1% conversion rate is top quartile in home improvement and below median in beauty.
.png)
Your conversion rate shows how much you are losing, not where
Conversion rate is an output. Two stores can both sit at 1.5% for opposite reasons. One loses shoppers on product pages that never earn an add to cart. The other loses them at checkout.
Enter your funnel numbers and the calculator compares each stage to industry medians, then names your weakest one. Fix that stage first, because every stage after it improves too.
Why benchmark with scandiweb

We run the programs, not just the audits
We deliver CRO for Puma, Jaguar Land Rover, and BMW, from strategy through implementation, with one team.

Our benchmarks come from running stores
We build and operate eCommerce stores every day, so our ranges reflect what is achievable rather than what is reported.

We name the weak stage, then fix it
The funnel diagnosis in this tool is the first step of our audit, compressed into three inputs.

We test what we can ship
Our experiments come with development capacity behind them, so results reach production instead of a backlog.

We fix your tracking first
Most benchmark gaps are partly measurement gaps. We make the data reliable before we read it.

23+ years and 2100+ eCommerce projects
Across Shopify, Adobe Commerce, and custom stacks.
The brands we build for

eCommerce conversion rate questions, answered
What is a good conversion rate for an eCommerce store?

It depends almost entirely on your industry. Across all of eCommerce the median sits near 2%, but the honest range runs from about 0.9% for jewelry and luxury to about 3.6% for food and beverage. A useful target is the top quartile of your own industry: 3.1% in fashion and apparel, 4.6% in beauty, 2.2% in furniture.
Why is my conversion rate below my industry average?
There are three common causes. Traffic mix comes first, because paid and social convert well below branded search, so more spend can lower the rate while revenue grows. Mobile experience comes second, because mobile usually converts at about half the desktop rate. Checkout friction comes third. Diagnose by stage before you change anything.
How much can CRO realistically improve conversion rate?
A sustained program usually delivers a 10% to 30% relative lift over 6 to 12 months, which moves a 1.5% rate to between 1.65% and 1.95%. That sounds small until you price it. On 120,000 monthly sessions at a $95 average order value, a 15% relative lift is worth about $318,000 a year.
What conversion rate should a new store expect?
Below the bottom quartile of its industry for the first few months, and that is normal. New stores have no brand search, no returning customers, and no reviews, and those are the three things that lift the rate most. Judge a store under a year old on its trend rather than its position.
How do I calculate my eCommerce conversion rate?
Divide orders by sessions over the same period, then multiply by 100. 1,860 orders from 120,000 sessions is a 1.55% conversion rate. Use sessions rather than users, and keep the definition consistent. Switching between the two can move the number by 30% or more with nothing changing on the site.
Does average order value affect conversion rate?
Yes, and it predicts conversion rate more reliably than the industry label does. Stores with baskets under about $60 convert at roughly three times the rate of stores above $200, because higher prices mean longer consideration and more comparison shopping. A low conversion rate paired with a high average order value is often a healthy business.
Should I measure conversion rate by session or by user?
Use sessions for benchmarking. Session based rates are what platform level benchmark data reports, so a user based rate compared against them will look flattering and wrong. Track both internally if it helps, but benchmark on sessions.
Where does this benchmark data come from?
The percentiles are compiled from published 2025 and 2026 eCommerce benchmark aggregates, including IRP Commerce sector data, Dynamic Yield, Littledata, and Shopify store panels. All figures are normalized to a session based conversion rate across all devices. Treat them as a directional market range rather than an audited census.

Services to improve your eCommerce conversion rate
You have the number. Now get the plan.
A benchmark tells you a gap exists. An audit tells you which stage creates it, why it happens, and what closing it is worth. We will send you both at no cost.